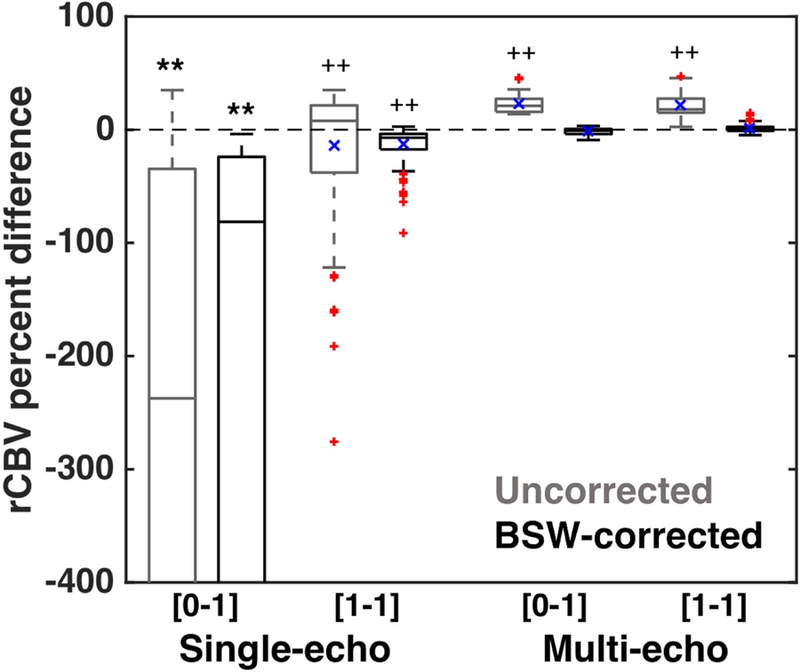
Figure 5.

rCBV percent difference between the estimated and expected rCBV for single-echo (126 combinations) and multi-echo (396 combinations) parameter combinations. Single-echo rCBV without a preload was significantly different from the expected rCBV, even with leakage correction (p < 0.001, **). Secondary analysis revealed that only corrected multi-echo rCBV was not significantly different from 0 (all others: p < 0.001, ++), across all dosing strategies, field strengths, TRs, FAs, and TE combinations. Significant differences from preliminary ANOVA are indicated by ** (p < 0.001) and secondary ANOVA are indicated by ++ (p < 0.001). The horizontal bar in each boxplot indicates median values, while the blue x indicates mean values. The mean values for each column can also be found in the text.
