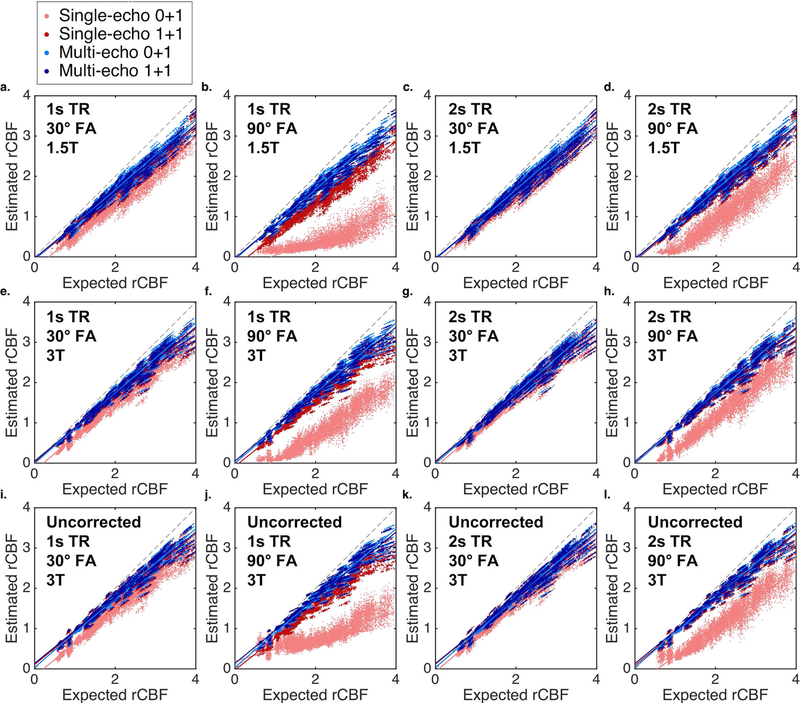
Figure 8.
Scatter plots between the expected (no leakage) and estimated (BSW-corrected) rCBF for single-echo (TE = 30ms, red) and multi-echo (TE = 2 and 30ms, blue) with no preload (light color) and with preload (dark color) for TR and FA combinations (columns) at 1.5 (a-d) and 3T (e-h). To determine the impact of leakage correction, the bottom row (i-l) shows uncorrected rCBF for each combination (3T only). Across all combinations, including both multi-echo and single-echo, there is a trend of increasingly underestimated rCBF as rCBF increases. Solid lines indicate best-fit lines, while the black dashed lines indicate the line of unity.

