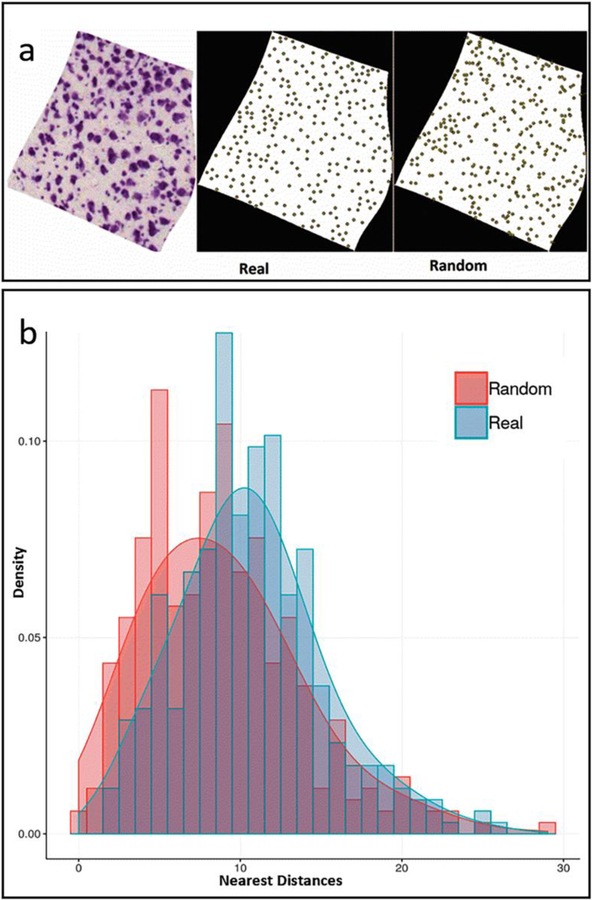
Fig. 5.
Spatial distributions: a. Nissl stained image (left) for a representative image (79_ENTl4–5), segmentation centroids (center), and randomized points (right); b. Frequency histograms and corresponding probability density functions for real and randomized nearest distances. Figure was created using Microsoft Excel, Microsoft PowerPoint, R and Adobe Photoshop

