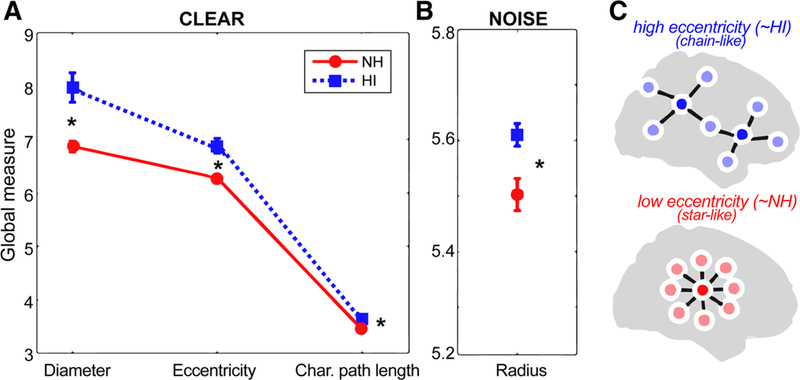
Fig. 2.

Group comparison of mean global brain connectivity measures during clear and noise-degraded speech processing. a Graph measures of diameter, eccentricity, and characteristic path length were larger in HI compared to NH listeners when processing clear speech. b For noise-degraded speech, only radius measures of the network differed between groups. c Schematic of two functional brain networks varying in eccentricity (see Fig. 3 for raw data). High eccentricity networks (like that of HI listeners) have more chain-like global configuration reflecting less integration and more long-range neural signaling; low eccentricity networks (like that of NH listeners) have configurations that are more integrated and “star-like.” After He et al. (2018). See text for definitions of graph metrics. *p < 0.05, error bars = ± s.e.m
