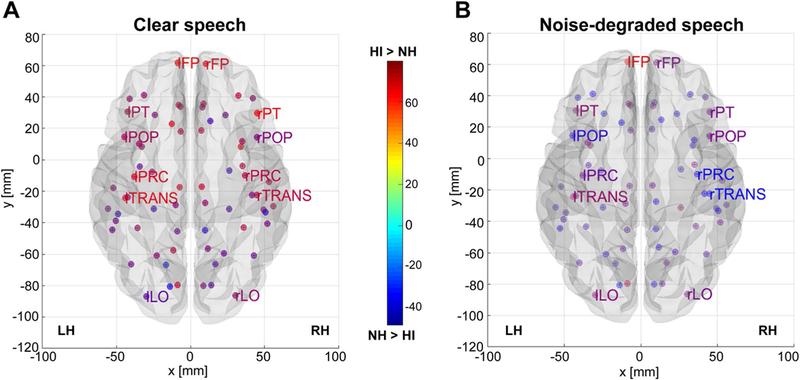
Fig. 3.

Group contrast of full-brain nodal eccentricity as a function of speech SNR. a Clear speech. b Noise-degraded speech. Hotter colors denote nodes of the DK atlas (Desikan et al. 2006) where HI listeners showed larger interconnectivity (eccentricity) between network nodes [(i.e., HI > NH); cooler colors, NH > HI]. Note the stronger eccentricity in the HI group in frontal and temporal sites. Functional data are projected onto the BRAPH glass brain template (Mijalkov et al. 2017). For clarity, only select DK ROIs are labeled. FP, frontal pole; LO, lateral occipital; POP, pars opercularis (i.e., “B1”); PT, pars triangularis (i.e., “B2”); PC, precentral gyrus (i.e., “M1”); TRANS, transverse temporal gyrus (i.e., “A1”)
