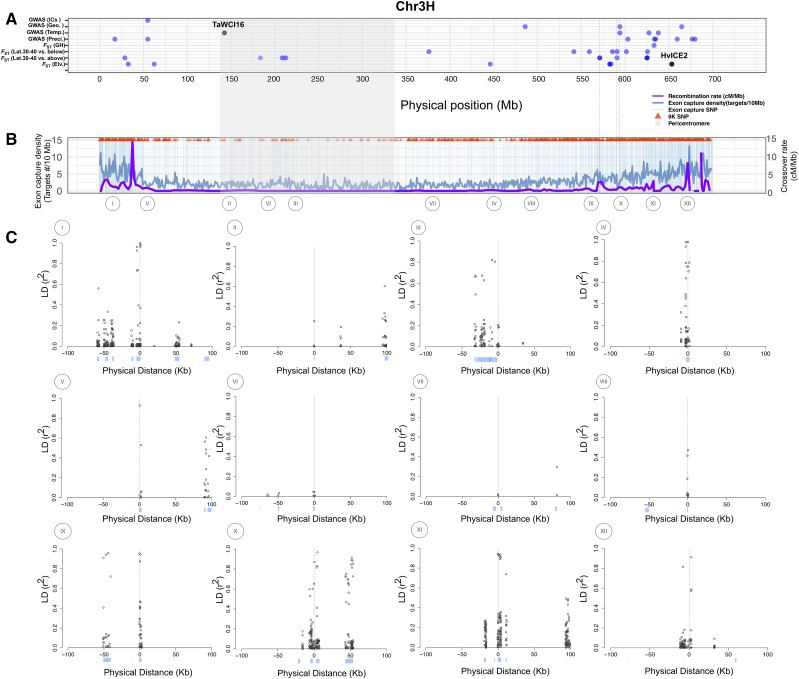
Figure 4.
(A) The genomic distribution of outlier SNPs identified according to the FST comparisons of elevation (below 3,000 m vs. above 3,000 m), low latitude (below 30°N vs. 30-40°N), high latitude (30-40°N vs. above 40°N), growth habit (winter vs. spring) and association analysis of 21 bioclimatic variables, which are categorized into three classes (precipitation, temperature, and geographic variables) on chromosome 3H. (B) Exome capture target density (dark blue line), crossover rate in cM/Mb (purple line), the genomic distribution of SNPs identified in the 62 barley landraces (vertical light blue lines), and 9K SNPs (red triangles) on chromosome 3H. The vertical dotted lines in panels (A) and (B) indicate that those outlier SNPs are shared across different traits. (C) LD plots for SNPs significantly associated with at least one bioclimatic variable (bottom) on chromosome 3H. Each plot shows a 200 Kb window, 100 Kb on either side of the SNP. For the LD plots, genotyped SNPs are at location 0, and positions upstream and downstream are listed as negative and positive values. The light blue bars are genes in 200 Kb windows surrounding the genotyped SNPs. The SNPs from the I to XII are: 11_20742, 11_10380, SCRI_RS_173916, 12_20108, 11_10601, 12_31008, SCRI_RS_173717, SCRI_RS_6793, SCRI_RS_207408, 12_10210, SCRI_RS_192360, and 12_30960.

