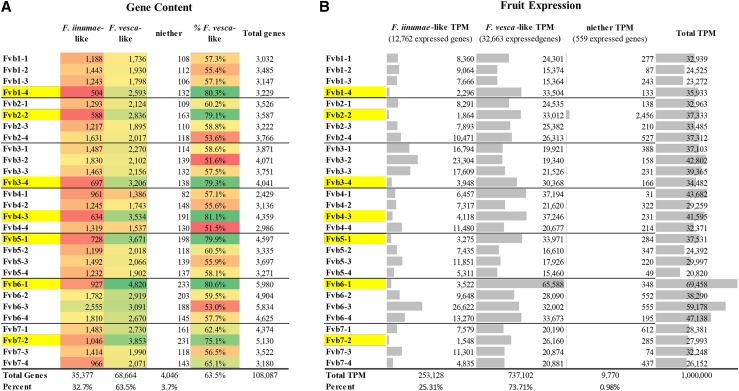
Figure 6.
General Retention and Expression Bias in Octoploid Strawberry. ‘Camarosa’ gene models from every chromosome are categorized as either more F. vesca-like, more F. iinumae-like, or neither. Red-green color scale indicates low-to-high gene content, respectively. Yellow highlight indicates the most F. vesca-like homeologous chromosome. A. Gene content per homeologous chromosome, by putative ancestral gene similarity. B. Relative transcript accumulation of all genes in the fruit, by putative ancestral similarity.

