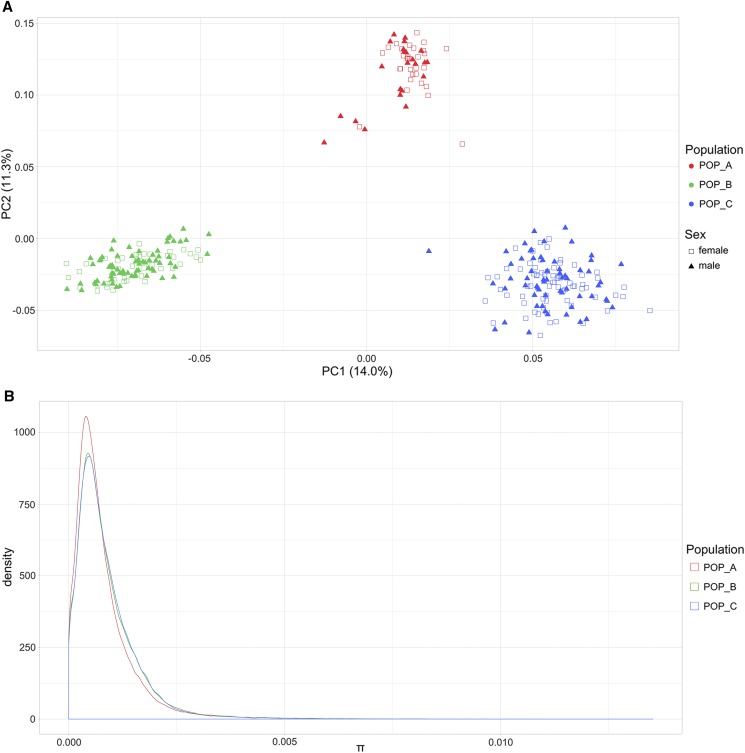
Figure 1.
Population genetic structure of males and females, and nucleotide diversity from three Nile tilapia (Oreochromis niloticus) farmed populations. (A) Principal Components Analysis for POP_A (red), POP_B (green) and POP_C (blue). Females are represented by unfilled squares and males by triangles. (B) Nucleotide diversity of POP_A (red line), POP_B (green line) and POP_C (blue line).

