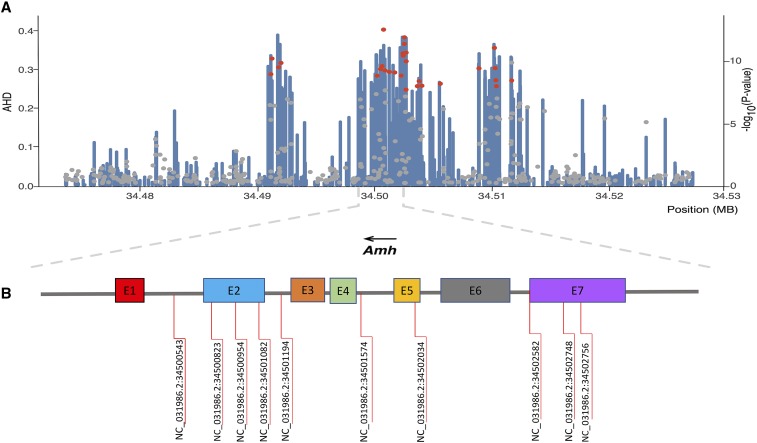
Figure 4.
Regional plot of SNP associated with sex determination on chromosome 23. (A) SNPs are plotted by position on the chromosome (x-axis) and the average heterozygosity difference (AHD) between males and females across all populations is represented by blue bars (y-axis). The significance (-log10(p-value)) of SNPs associated with phenotypic sex (red dots) and harboring the Amh gene (gray dots) is also shown (secondary y-axis). (B) The Amh gene and SNPs significantly associated with sex determination.

