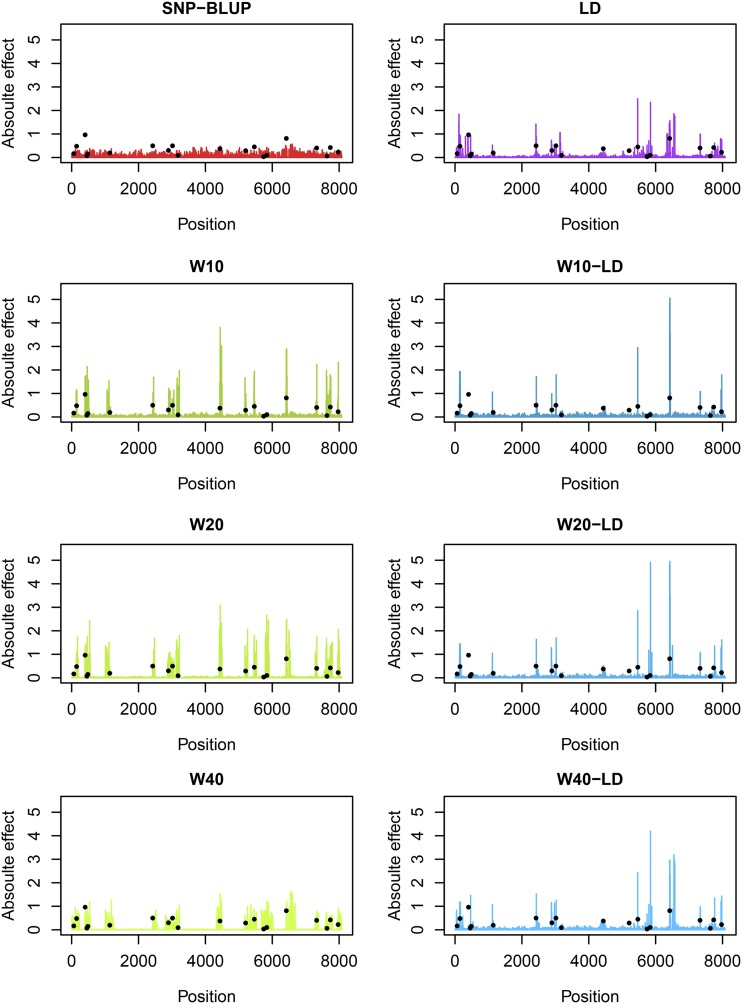
Figure 1.
Simulated QTL effects (black dots) and fitted SNP effects under SNP-BLUP and 7 alternative models (Categorical: W10, W20 and W40, Continuous: LD, Combination: W10-LD, W20-LD and W40-LD) for one simulation replicate under simulation scenario Sc0 with 10 QTL per chromosome underlying the trait.

