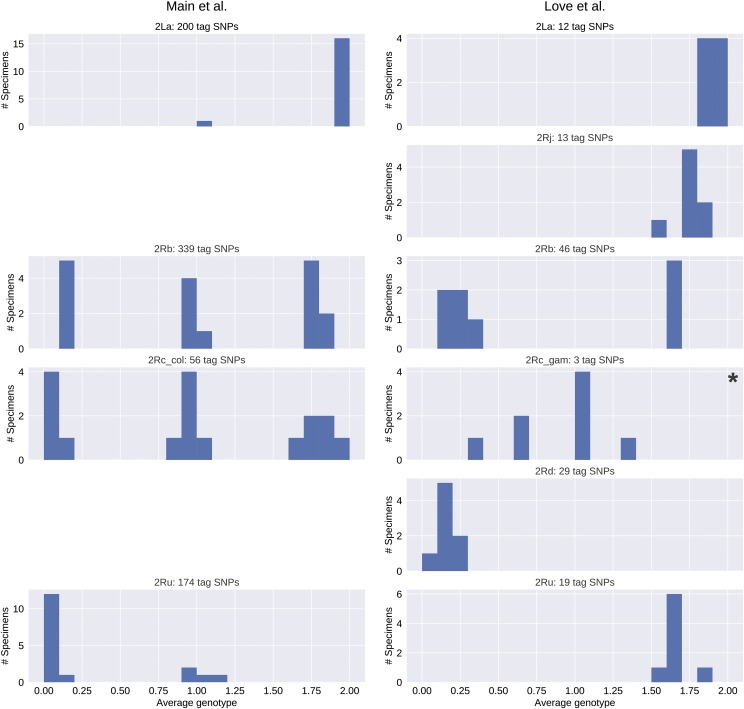
Figure 6.
Histograms of computational karyotyping scores calculated by interrogating tag SNPs in An. gambiae and An. coluzzii mosquitoes re-sequenced independently of the Ag1000G pipeline, often at lower sequencing depth. Scores cluster near 0, 1, and 2 with little dispersion except when taxon-specific tag SNPs are applied to a different taxon (indicated by an asterisk).

