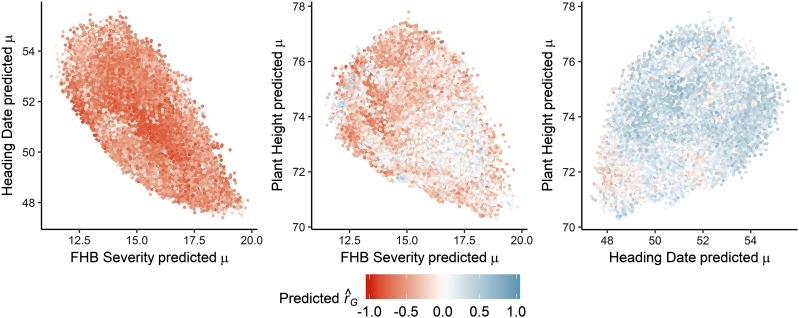
Figure 4.
In the barley breeding population used to empirically validate predictions, the relationship between the predicted cross means () of three pairs of traits for n = 330,078 potential crosses mirrored the overall distribution of predicted genetic correlations (), shaded from red (negative) to blue (positive). FHB, Fusarium head blight.

