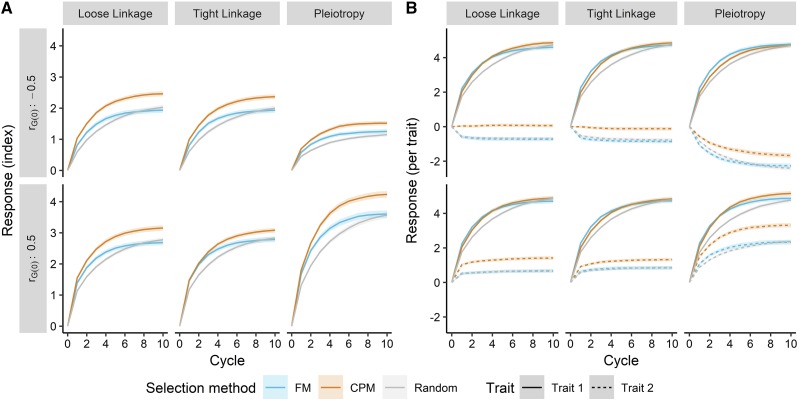
Figure 5.
Selecting crosses on the predicted correlated/superior progeny mean (CPM, orange) led to a greater long-term response (in units of genetic standard deviations) compared to selection on the predicted family mean (FM), blue) or by random selection (gray). This was true for a two-trait index (A) and both traits individually (B) across three correlation architectures and two base genetic correlations (rG(0)). Lines denote the mean of 250 simulation replicates, and the ribbon denotes a 95% confidence interval.

