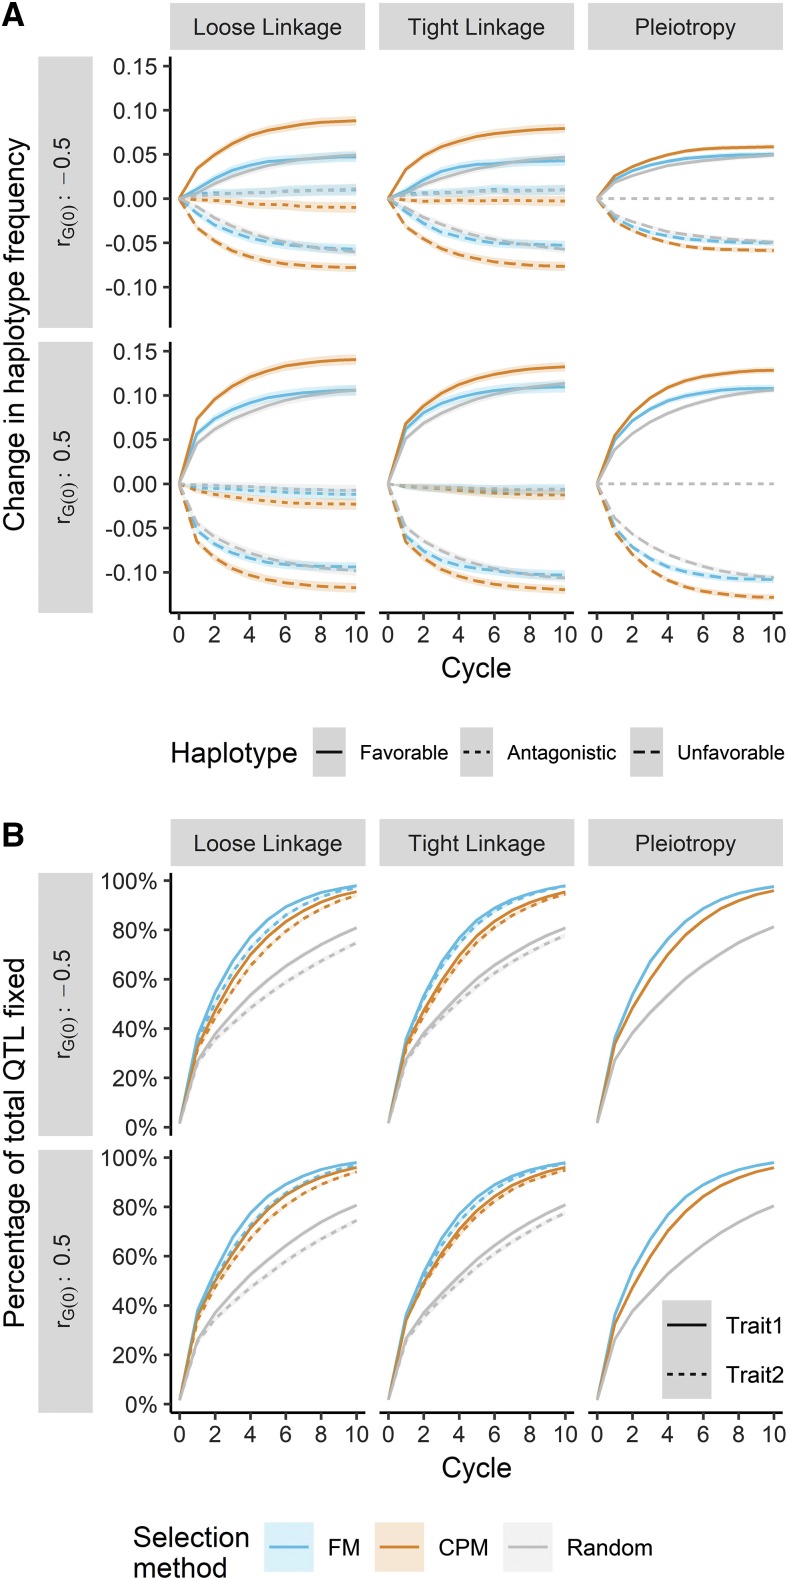
Figure 7.
The change in frequency of two-trait quantitative trait locus (QTL) haplotypes and proportion of fixed QTL depended on the cross selection method genetic architecture, and base genetic correlation (rG(0)). (A) The increase in frequency of favorable (solid) haplotypes and decrease in frequency of unfavorable (dashed) and antagonistic (dotted) haplotypes was always greater when selecting crosses on the correlated/superior progeny mean (CPM, orange). (B) The rate of QTL fixation for both trait 1 (solid) and trait 2 (dotted) was always greatest with cross selection on the family mean (FM, blue), followed by CPM and random mating (gray). Lines denote the mean of 250 simulation replicates, and the ribbon denotes a 95% confidence interval.

