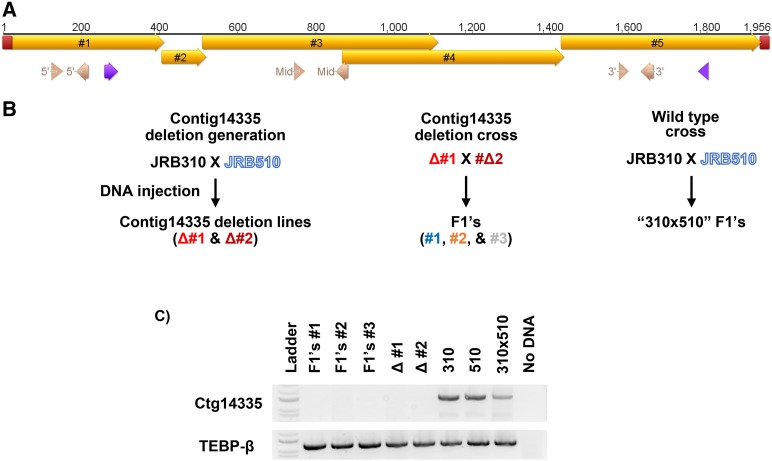
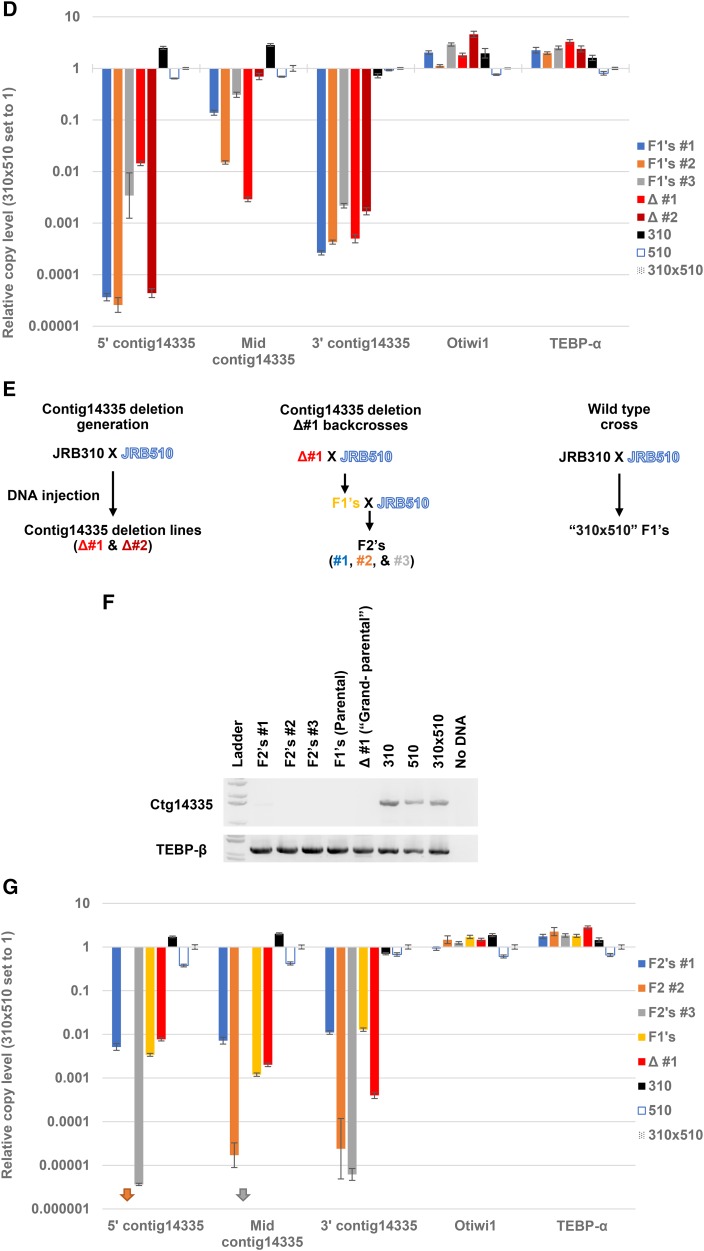
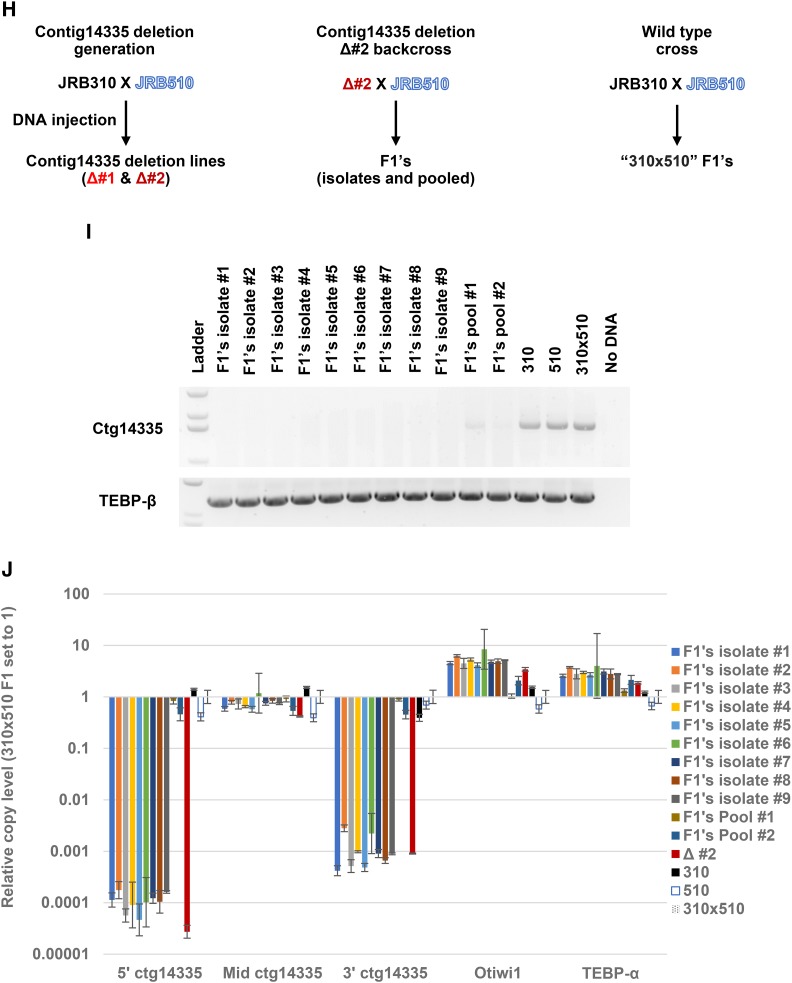
Figure 4.
Deletions and remnants are epigenetically inherited A) An illustration of the contig14335.0 with primer locations depicted (purple for the detection PCR shown in panels C and E, pink for the qPCR primers, labeled with the corresponding qPCR they belong to in panels C, E, G). In addition, the locations of the MDSs (gold) and telomeres (red) on the nanochromosome are shown. B) Diagram of the various crosses involved generating the progeny involved in panels C and D. The colors in the diagram correspond to the colors in panel D. C) PCR amplification of genomic DNA harvested from populations of the progeny of ctg14335.0 deletion line 1 mated to deletion line 2, with parental lines and grandparental lines, along with uninjected 310x510 as controls. Lower gel section shows PCR amplification of TEBP-β as loading control. D) Quantitative PCR on the F1 from ctg14335.0 deletion line 1 mated to deletion line 2 surveyed across various regions of the contig14335.0 nanochromosome. E) Diagram of the various crosses involved generating the progeny involved in panels F and G. The colors from the diagram correspond to the colors in the following panel G. F) PCR amplification from genomic DNA harvested from populations of ctg14335.0 deletion line 1 backcrossed to wt strain JRB510 for up to 2 generations (labeled F1 and F2) with parental lines and grandparental lines along with uninjected 310x510 as controls. Lower gel section shows PCR amplification of TEBP-β as loading control. G) Quantitative PCR on genomic DNA used in panel A across multiple locations of ctg14335.0, together with an unrelated locus, TEBP-α. Arrows represent undetectable levels at the respective loci, with arrow color corresponding to the legend. Relative copy levels were determined by setting the levels of JRB310xJRB510 F1 to 1. H) Diagram of the various crosses involved generating the progeny in panels I and J. The colors from the diagram correspond to the colors in the following panel J. I) PCR amplification of genomic DNA harvested from clonal isolates and populations (labeled respectively) of the progeny of ctg14335.0 deletion line 2 backcrossed to JRB510, with parental and grandparental lines, along with uninjected JRB310xJRB510 as controls. Lower gel section shows PCR amplification of TEBP-β as loading control. J) Quantitative PCR on F1 genomic DNA from ctg14335.0 deletion line 2 across various regions of contig14335.0.


