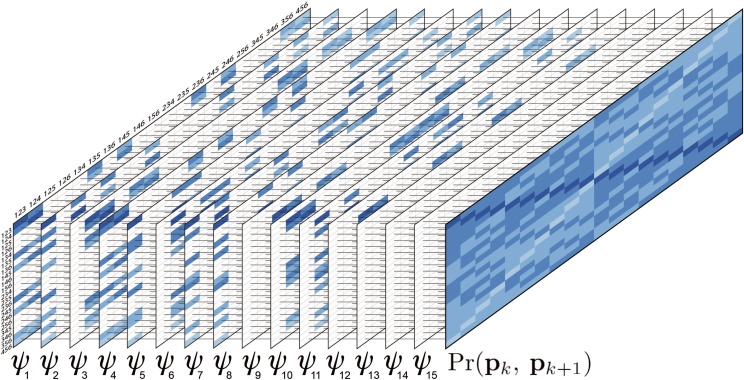
Figure 2.
Graphical representation of Equations 2 and 3 for autohexaploid gametes. The first 15 tables represent the gametic probabilities given different bivalent configurations (Equation 2). The rows and the columns indicate gametic configurations for loci k and , respectively. For simplification, only the superscripts of the gametic configurations were presented. For example, row 123, column 123, represent the gamete . Colored cells indicate the probability of gametic configurations consistent with the bivalent configuration . The color scale indicates the number of recombinant bivalents associated to the gametic probability varying from 0 (dark blue) to 3 (light blue). Blank cells indicate non-consistent configurations. The far right full table represents the sum over all ψ configurations, weighted by their probability (Equation 3).

