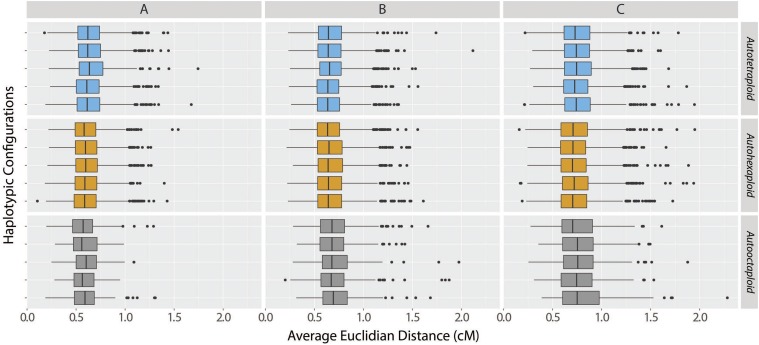
Figure 5.
Distributions of the average Euclidean distances between the estimated and simulated distance vectors considering correctly estimated linkage phase configurations. The order of boxplots is the same as the order of haplotypes in Figure S4. Each column indicates the results for different linkage phase configuration scenarios, namely, A, B and C, and each row indicates a different haplotypic configuration within three ploidy levels.

