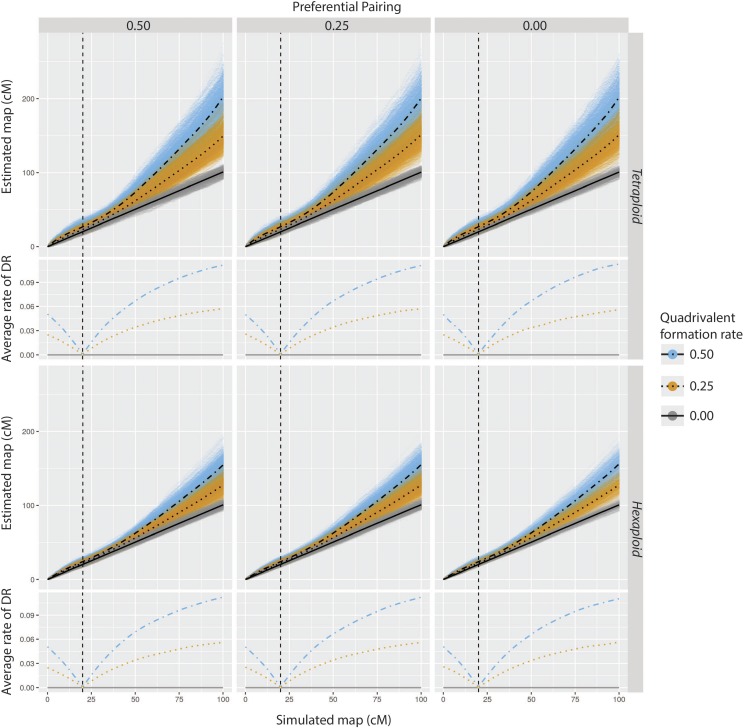
Figure 6.
Comparison of estimated vs. simulated maps given a correct estimation of linkage phases in simulation 2. Smoothed conditional means of the observed average rate of double reduction is presented along with the simulated chromosome. The centromere was positioned at 20 cM from its beginning (vertical dashed line). Upper panels show the results for tetraploid simulations while lower panels show the results for hexaploid simulations. Three levels of preferential pairing (0.00, 0.25, 0.50) and three levels of quadrivalent formation rate (0.00, 0.25, 0.50) were simulated. The lines superimposed to the scatter plots are smoothed conditional means of the distances using a generalized additive model. Both two-point thresholds were considered since they only affect the phasing procedure.

