Figure 2.
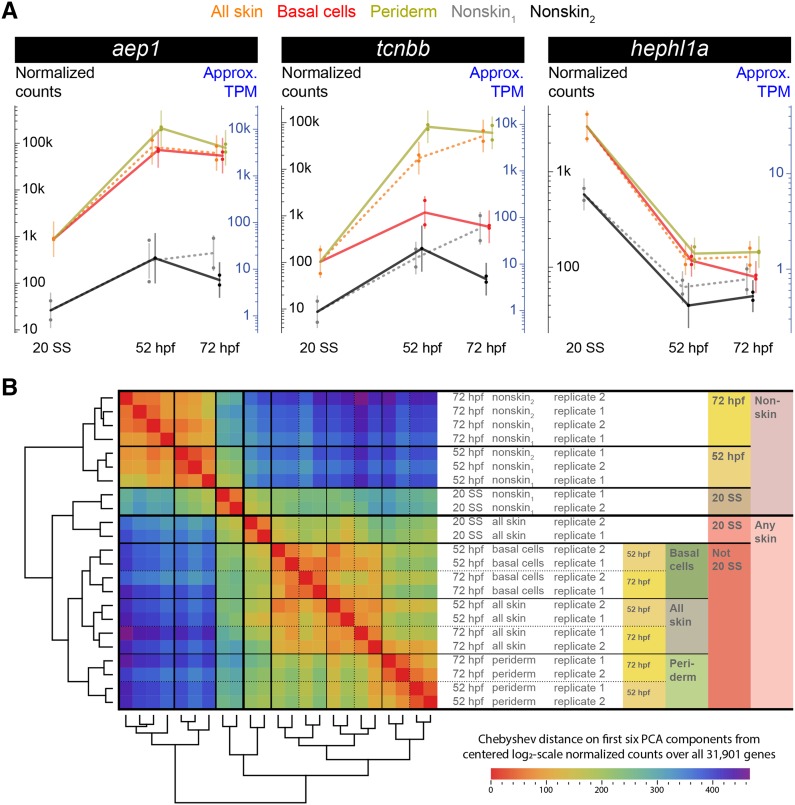
RNA-Seq transcriptomes reveal gene expression profiles, and cluster analysis of experiments. A) Three example expression profiles. In each plot, 23 dots (one for each experiment) show normalized expected read counts; dot color and placement indicates condition (with slight horizontal jitter to reduce visual overlap). For each condition, a vertical bar indicates the statistical model normal distribution (see File S1), with the bar vertically centered at the mean, and with tips at twice standard error away from the mean (hence, approximately indicating 95% confidence intervals). Approximate Transcripts Per Million (TPMs) are also shown (see File S1). Lines connect tissue means across timepoints (at 20 SS: using nonskin1 for nonskin2, and all skin for periderm and basal cells). B) Blind clustering of experiments: centered unscaled Principal Components Analysis (PCA) was performed on normalized transformed (log2-scale) expected counts for all 23 experiments using all 31,901 genes. The distance matrix and dendrograms after hierarchical clustering on the first six PCA components (using complete linkage with Chebyshev distance and optimal swiveling to minimize sum of adjacent leaf distances) are shown. The largest difference was between nonskin and skin conditions. Among nonskin experiments, timepoint was the next largest difference. In skin, 20 SS vs. 52/72 hpf was the second largest difference, followed by layers, and finally 52 hpf vs. 72 hpf. At 52 and 72 hpf, experiments involving all skin cells were more similar to basal cells than to periderm.

