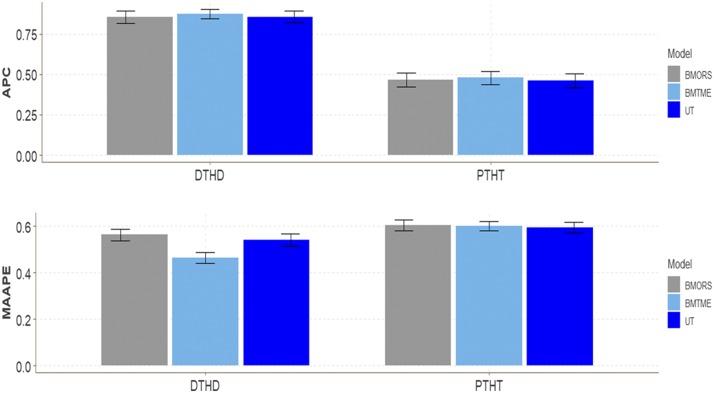
Figure 2.
Wheat dataset 2. Performance of three models (BMTME, BMORS and UT) under study in terms of average Pearson’s correlation (APC) and mean arctan absolute percentage error (MAAPE) for two traits: days to heading (DTHD) and plant height (PTHT). Three environments were included: bed planting with two irrigation levels (Bed2IR), bed planting with 5 irrigations levels (Bed5IR), and drip irrigation (Drip).

