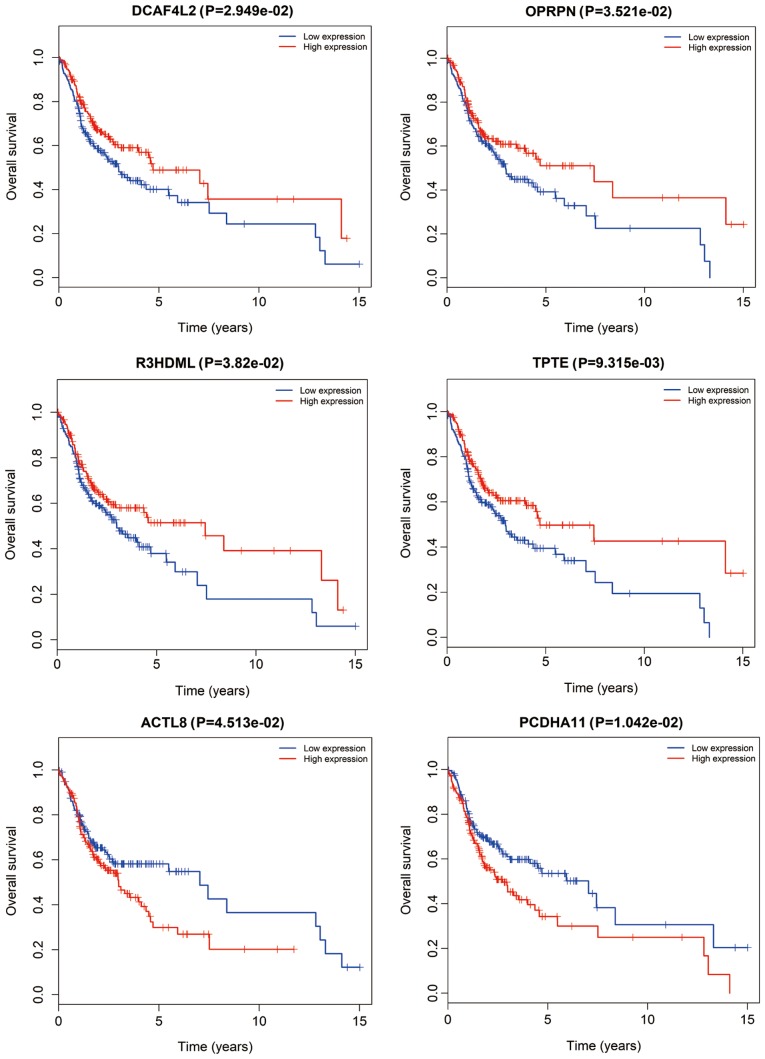
Figure 6.
Kaplan-Meier survival curves of six genes associated with overall survival in oral squamous cell carcinoma. The horizontal axis represents overall survival time (years) and the vertical axis represents the survival function. DCAF4L2, DDB1 and CUL4 associated factor 4 like 2; OPRPN, opiorphin prepropeptide; R3HDML, R3H domain containing like; TPTE, transmembrane phosphatase with tensin homology; ACTL8, actin like 8; PCDHA11, protocadherin alpha 11.

