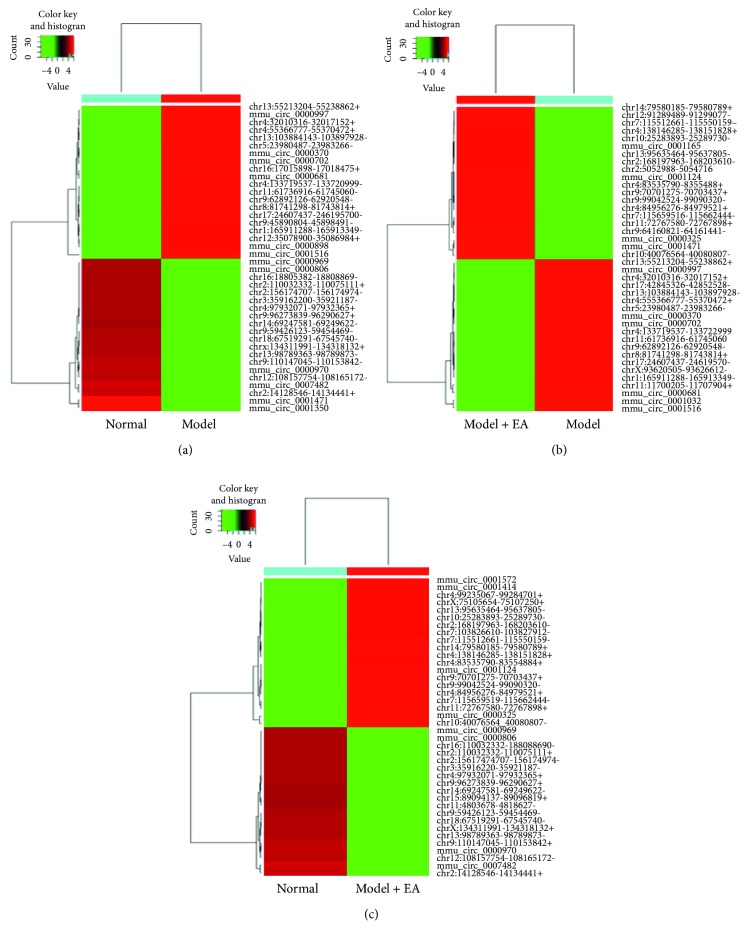
Figure 3.
Heat map and hierarchical clustering showing expression values of all differentially expressed circRNAs among the three groups. Each column represents a sample and each row represents a circRNA. Red strip represents high relative expression and green strip represents low relative expression. (a) Hierarchical cluster analysis between model and normal groups. (b) Hierarchical cluster analysis between model and model + EA groups. (c) Hierarchical cluster analysis between normal and model + EA groups.

