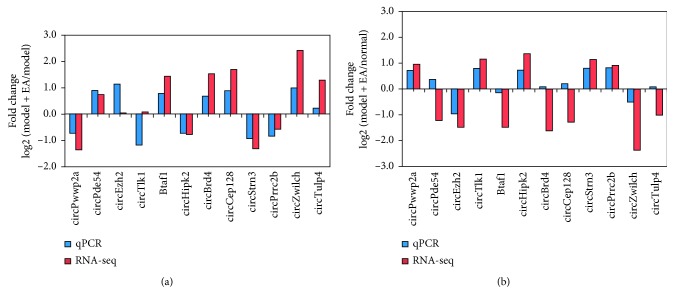
Figure 7.
qRT-PCR validation for the expression of 12 circRNAs. Comparison between RNA-seq data and qPCR results. The vertical axis shows the fold change (log 2 transformed) of each circRNA between the model + EA and model groups (a) or the model + EA and normal groups measured (b) by qPCR and RNA-seq, respectively.

