Figure 1.

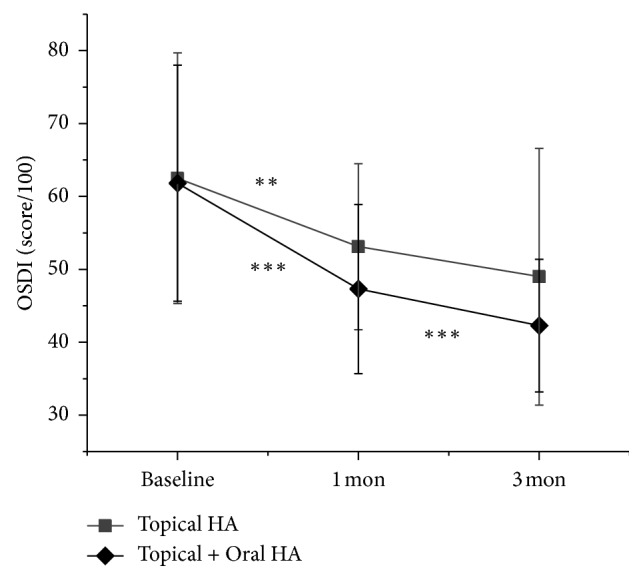
Change in ocular surface disease index (OSDI). Data are expressed as mean ± standard deviation (SD). Asterisks indicate values that are statistically significant between follow-up (∗∗P < 0.001 and ∗∗∗P < 0.001).

Change in ocular surface disease index (OSDI). Data are expressed as mean ± standard deviation (SD). Asterisks indicate values that are statistically significant between follow-up (∗∗P < 0.001 and ∗∗∗P < 0.001).