
Figure 1.
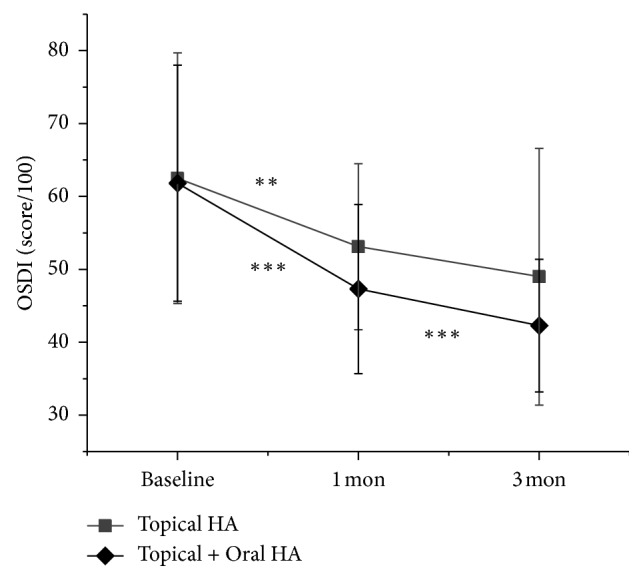
Change in ocular surface disease index (OSDI). Data are expressed as mean ± standard deviation (SD). Asterisks indicate values that are statistically significant between follow-up (∗∗P < 0.001 and ∗∗∗P < 0.001).
Official websites use .gov
A
.gov website belongs to an official
government organization in the United States.
Secure .gov websites use HTTPS
A lock (
) or https:// means you've safely
connected to the .gov website. Share sensitive
information only on official, secure websites.
Change in ocular surface disease index (OSDI). Data are expressed as mean ± standard deviation (SD). Asterisks indicate values that are statistically significant between follow-up (∗∗P < 0.001 and ∗∗∗P < 0.001).