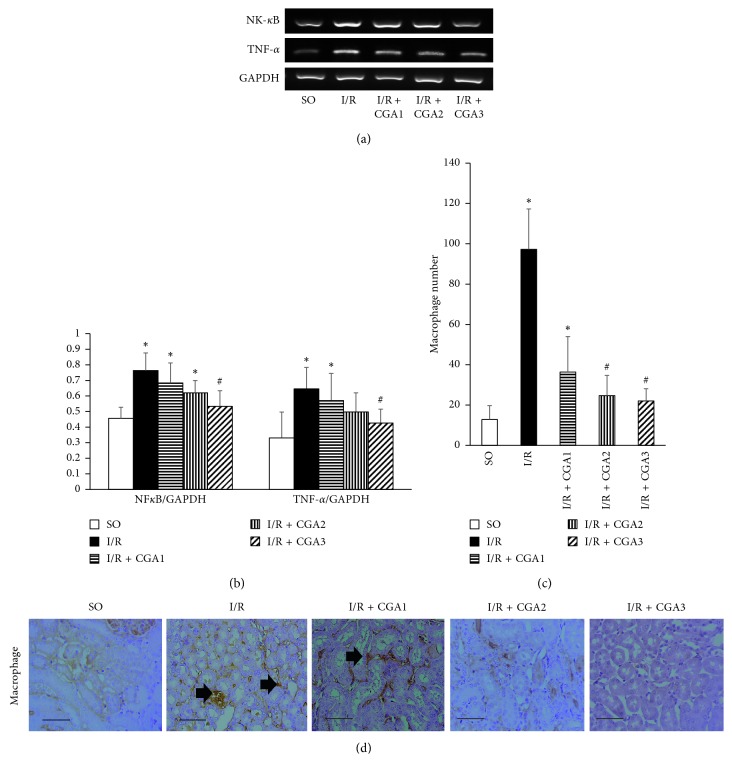
Figure 3.
(a, b) Reverse transcriptase-PCR (RT-PCR) analysis of NF-κB and TNF-α mRNA expressions. The IR + CGA3 group demonstrated significantly lower NF-κB and TNF-α mRNA expressions compared to the IR group. (b) Representative pictures of CD68 immunostaining for macrophage marker. Positive staining is shown in interstitial areas (black arrow). (c) Quantification of the macrophage number showed reduction of the numbers in CGA-treated groups, especially the IR + CGA3 group. (d) Representative pictures of CD68 immunostaining for demonstrating macrophage infiltration (black arrows). ∗p < 0.05 vs. SO group. #p < 0.05 vs. IR group.

