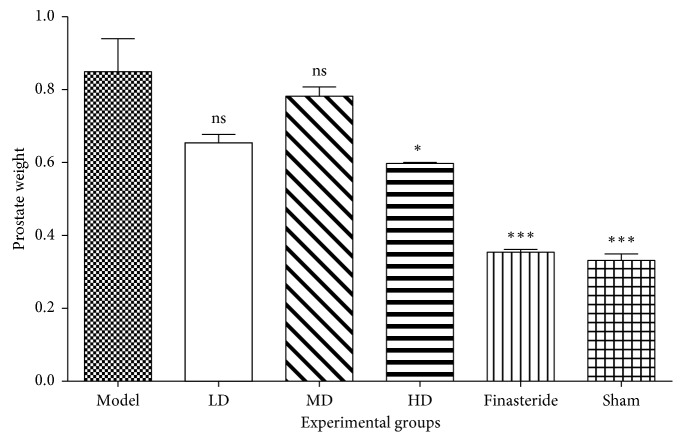
Figure 1.
Mean prostate gland weights of experimental groups after 21 days of treatment. Data are presented as mean ± standard error of mean (n = 6) (ns = no significance, ∗p < 0.05 and ∗∗∗p < 0.0001). Compared to the disease control group (one way ANOVA followed by Bonferroni's post hoc). This figure demonstrates the change in prostate weights of various groups after treatment. When prostate weights were compared to disease (testosterone groups), there was a statistically significant decrease in prostate weights. Groups treated with 30 mg/kg·b.wt. and 100 mg/kg·b.wt. resulted in no significant reduction in prostate weight, while those treated with 300 mg/kg·b.wt. produced a significant decrease in prostate weight.

