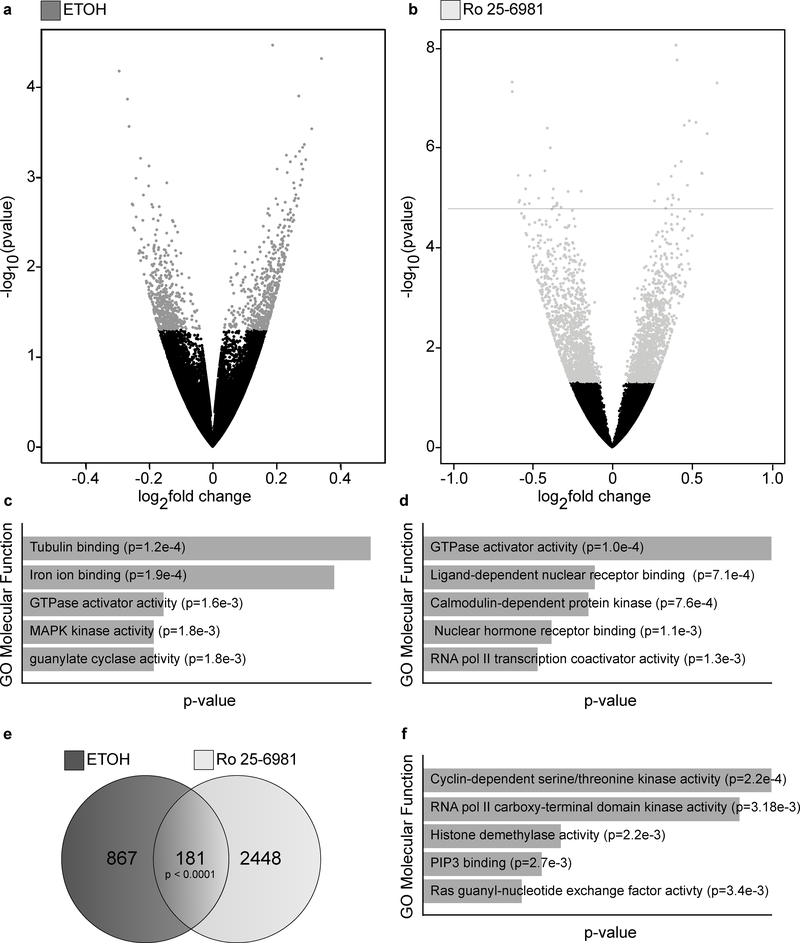
Figure 1.
Acute ethanol and Ro 25–6981 treatment induced differentially expressed genes (DEGs). C57BL/6 male mice were treated (45 minutes) with vehicle (saline, n=8), ethanol (ETOH, 2.4 g/kg, n=7), or Ro 25–6981 (10 mg/kg, n=8). RNA-Seq and DEG analyses were performed using polyA-enriched RNA isolated from hippocampal synaptoneurosomes. Volcano plots for (A) ethanol and (B) Ro 25–6981, indicating up- and downregulation (log2 fold-change; x-axis) and statistical significance (-log nominal p-value; y-axis). Grey points indicate significant (p ≤ 0.05) DEGs after (A) ethanol and (B) Ro 25–6981 treatment. Molecular function gene ontology (GO) enrichment results are represented in the bar graphs, depicting the top five highest-ranking GOs for the DEGs after (C) ethanol and (D) Ro 25–6981 treatment. Of the 1048 DEGs induced by ethanol (p ≤ 0.05) and the 2629 DEGs induced by Ro 25–6981 (p ≤ 0.05), there were 181 overlapping DEGs (E). The top five molecular function GOs for the overlapping genes are shown (F).

