
FIGURE 1. Regulation of intrarenal AGT and AGE in diabetic mice.
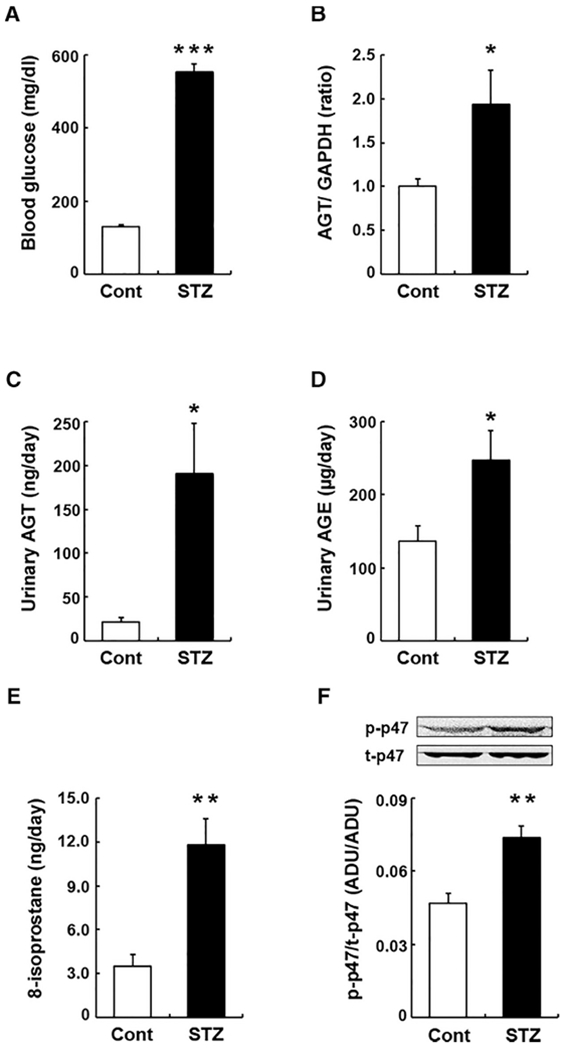
Levels of blood glucose (A), renal cortical AGT mRNA (B), urinary AGT protein (C), and urinary AGE (D) in control group (Cont, n = 6) and STZ-induced DM mice (STZ, n = 5). Graphs E and F show levels of urinary 8-isoprostane and phosphorylation of intrarenal p47phox protein. Data are expressed as mean ± SE. Asterisks (*P < 0.05, ** P < 0.01 and *** P < 0.001) indicate significant difference compared to control group. Abbreviations: AGT, angiotensinogen; AGE, advanced glycation end products; DM, diabetes mellitus; SE, standard error; STZ, streptozotocin.