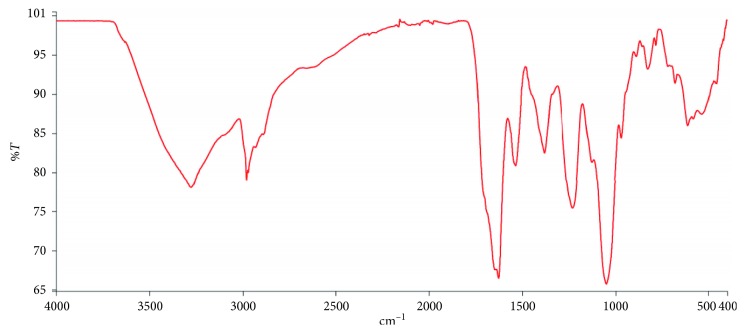
Figure 3.
FTIR spectrum of the EPS of Pseudomonas aeruginosa ATCC 4853. The EPS matrix was precipitated from air-media interface and contains absorption bands arising from N–H and O–H stretches in proteins and sugars (3280–3450 cm−1), –C–H– stretches in lipids and fatty acids (2850–2980 cm−1), amide carbonyl (–C=O) stretches in proteins (1540–1630 cm−1), as well as O-acetyl (–C–O–C–) stretches in polysaccharides and nucleic acids (900–1380 cm−1) [36, 44].

