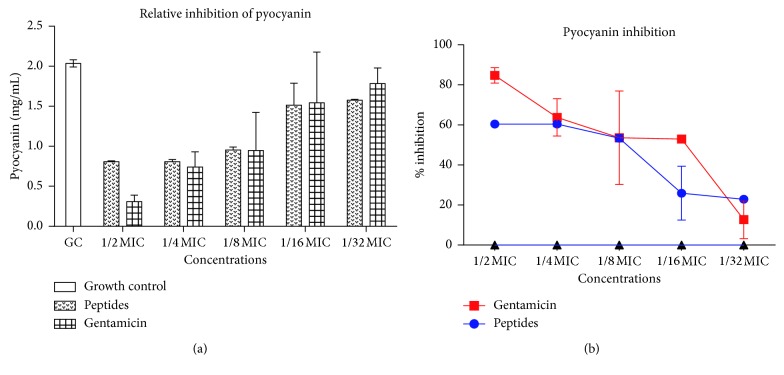
Figure 6.
Pyocyanin inhibition. (a) Pyocyanin production by Pseudomonas aeruginosa with and without sub-MIC doses of the peptide mix and standard drug, gentamicin. Each bar represents mean ± SD of pyocyanin levels in 3 independent experiments. (b) Percentage inhibition of pyocyanin secretion in Pseudomonas aeruginosa in the presence of sub-MIC doses of the peptide mix and gentamicin. Percentage inhibitions were computed with respect to the control group. Each bar represents mean ± SD of triplicate experiments.

