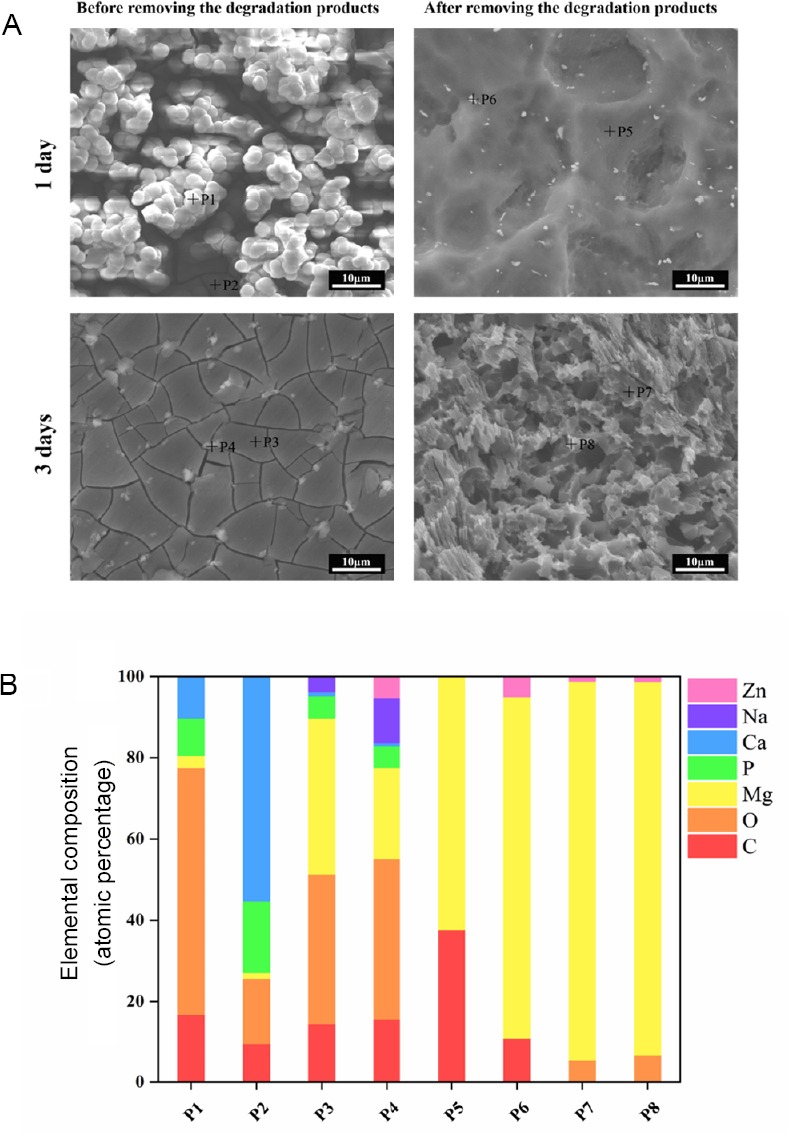
Figure 1.

Morphology and elemental composition of the immersed Mg-Zn- Y-Nd.
Note: (A) Scanning electron microscope images of Mg-Zn-Y-Nd surface after immersed in the cell culture medium for 1 and 3 days. Scale bars: 10 μm. (B) The energy dispersive spectrometer of the typical area on the Mg-Zn-Y-Nd surface after immersed in the cell culture medium for 1 or 3 days.
