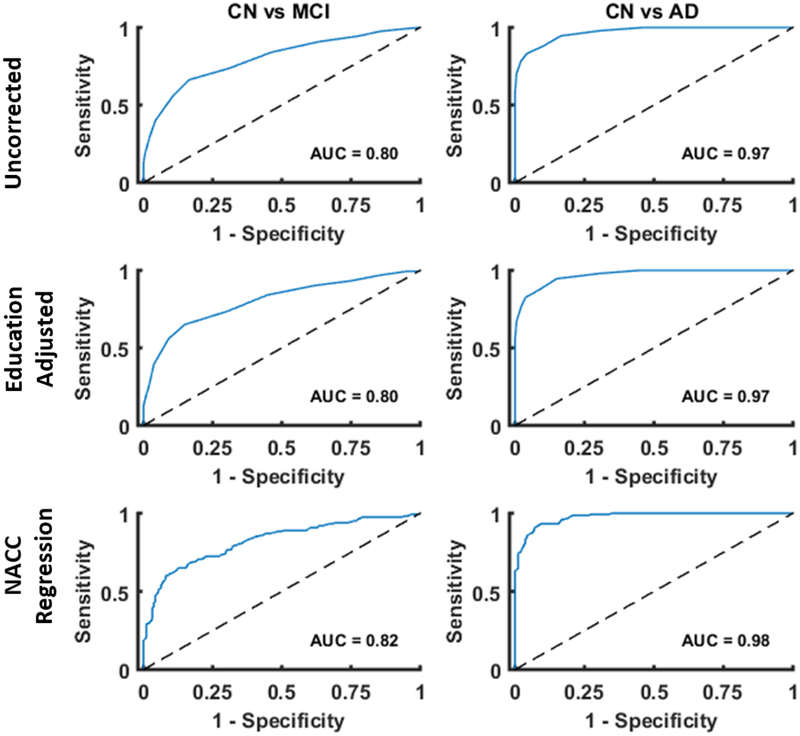
Figure 1. ROC plots of baseline MoCA scores with various normative adjustments applied.
Areas under the curve (AUC) were similar for ROC curves constructed with uncorrected MoCA scores, education adjusted scores, and NACC adjusted scores. There was a slight improvement when adjustments of increasing complexity were applied.

