
Fig. 1.
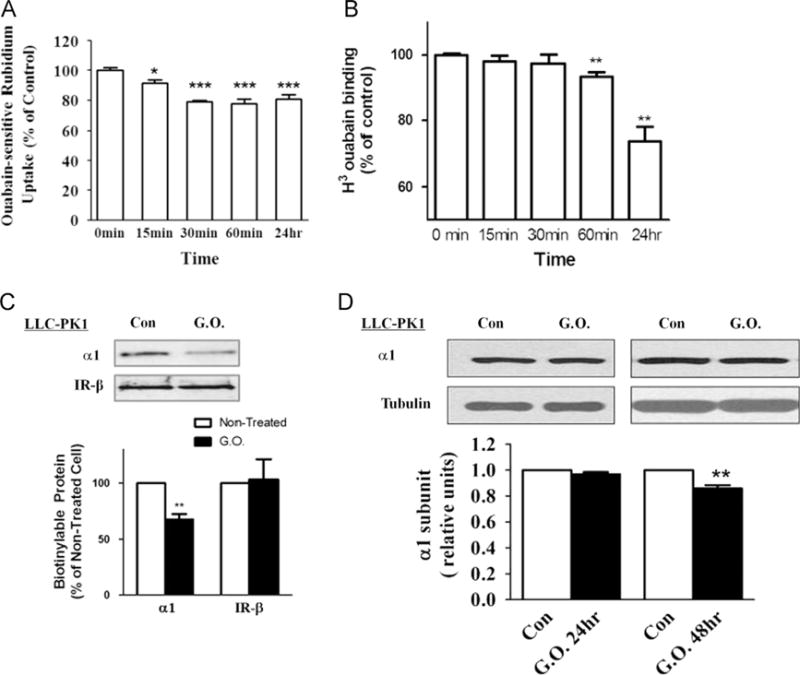
Effects of glucose oxidase (G.O.) treatment on Na/K-ATPase. (A) 86Rb+ uptake assay. Cells were treated with G.O. (3 mU/ml) for indicated times and ouabain-sensitive 86Rb+ uptake was measured as described under Material and methods. (B) [3H]Ouabain binding assay. Cells were treated with G.O. (3 mU/ml) for indicated times and surface expression of Na/K-ATPase was measured by ouabain binding as described under Material and methods. (C) Surface biotinylation assay. Cells were treated with G.O. (3 mU/ ml) for 24 h and biotinylated as described under Material and methods. The same volume of the bound fraction was analyzed by Western blot. (D) Representative immunoblots and quantification of Na/K-ATPase α1 subunit amount in total cell lysates. n=3–5. Values are expressed as the mean±SE. *p<0.05; **p<0.01; ***p<0.001 compared with control.