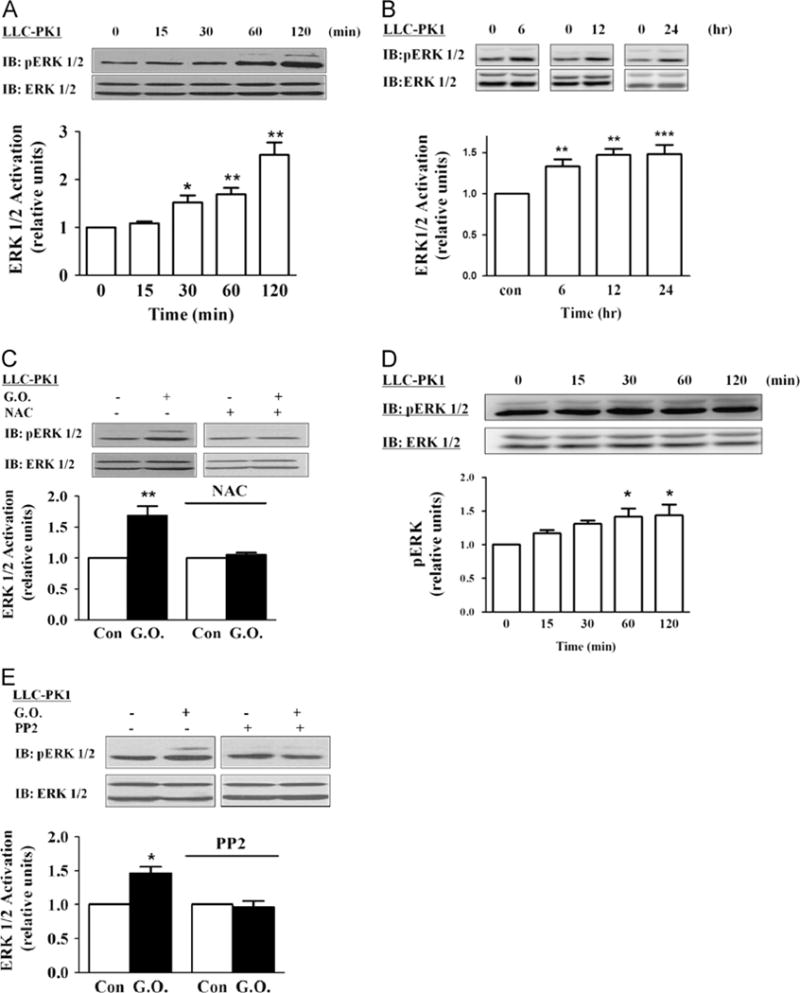
Fig. 3.

Effects of glucose oxidase (G.O.) on ERK1/2 activation. (A) Time course of ERK activation. Cells were exposed to G.O. (3 mU/ml) for the indicated times and assayed for ERK1/2 activation as described under Material and methods. Membranes were first probed with anti-phosphorylated (active) ERK antibody, then stripped, and reprobed by an anti-ERK antibody that recognizes total ERK. The active ERK values were normalized against the total ERK signal. The ratio was then expressed relative to the control value as 1. (B) Long-term effects of G.O. on ERK. Cells were exposed to G.O. (3 mU/ml) for up to 24 h, and cell lysates were assayed as for (A). (C) Cells were pretreated with 5 mM N-acetylcysteine (NAC) for 30 min and exposed to G.O. for 60 min, and cell lysates were assayed as for (A). (D) Cells were exposed to 50 μM H2O2 for up to 120 min. Cell lysates were assayed as for (A). (E) The effects of PP2 on G.O.-induced activation of ERK1/2. Cells were pretreated PP2 (2 μM) and exposed to 3 mU/ml G.O. for 60 min, and cell lysates were assayed as for (A). Representative immunoblots and quantitative data are shown. n=3–5. Values are expressed as the mean±SE. *p<0.05; **p<0.01; ***p<0.001 compared with control.
