Figure 1.
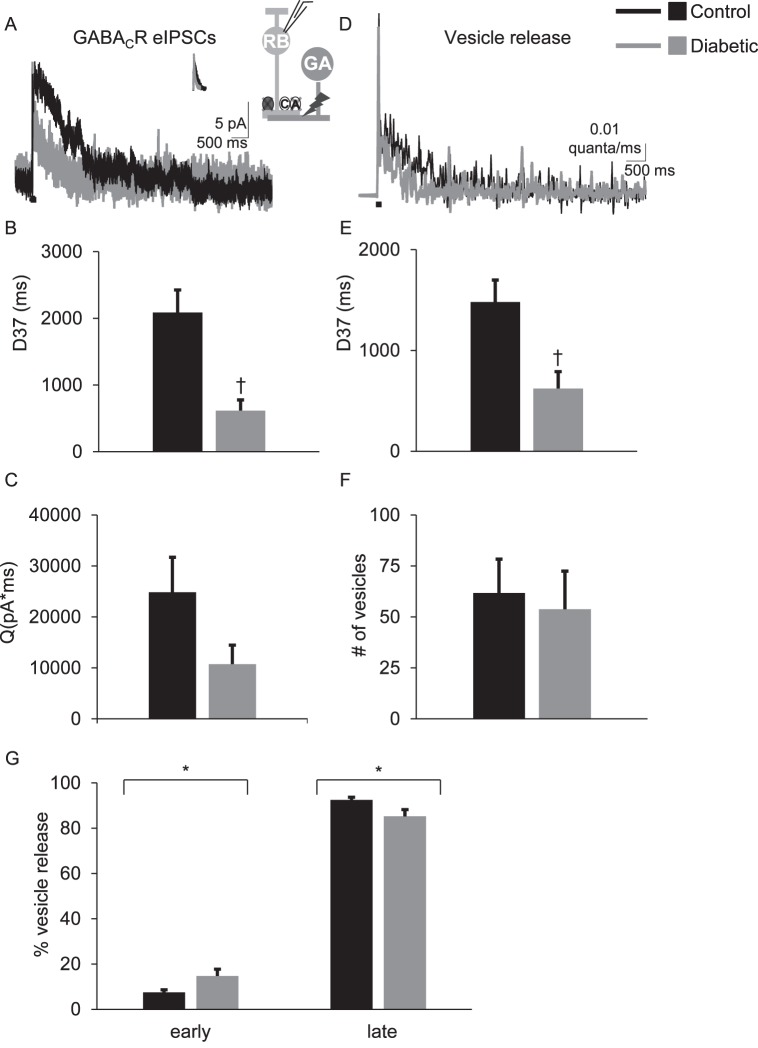
The timing of electrically evoked GABA release onto rod bipolar cell GABACRs is shortened after 6 weeks of diabetes. (A) Representative traces of rod bipolar cell GABACR eIPSCs evoked by a 1-ms electrical stimulus (black bar, timing not to scale) are shown. The insets show the average sIPSCs used for deconvolution analysis and a GABAergic amacrine cell (GA) being electrically stimulated to release GABA onto GABACRs (C) and GABAARs (A) on a recorded rod bipolar cell. Glycine (dark gray circle) and GABAARs are pharmacologically blocked (X's) to isolate GABACR currents. (B) The D37 was significantly faster in diabetic rod bipolar cells (n = 10 cells from 4 mice) than control (n = 7 cells from 4 mice, P = 0.0006 t-test) (C) Although the GABACR charge transfer (Q) is reduced, the difference is not statistically significant (P = 0.07 t-test) (D) Representative traces of the timecourse of vesicle release estimated using deconvolution analysis from data in (A) are shown. (E) The average D37 of vesicle release from diabetic cells is significantly faster than in control cells (P = 0.006 t-test). (F) There is no difference in the amount of electrically evoked vesicle release onto rod bipolar cell GABACRs (P = 0.77 t-test). (G) The amount of vesicle release that occurred during the early and late phases normalized to the total amount of vesicle release from control and diabetic cells is shown. In diabetic amacrine cells, there was an increase in the amount of vesicle release onto rod bipolar cell GABACRs that occurred during the early phase and a decrease in the amount of release that occurred during the late phase (P = 0.04 t-test). *P < 0.05, †P < 0.01.

