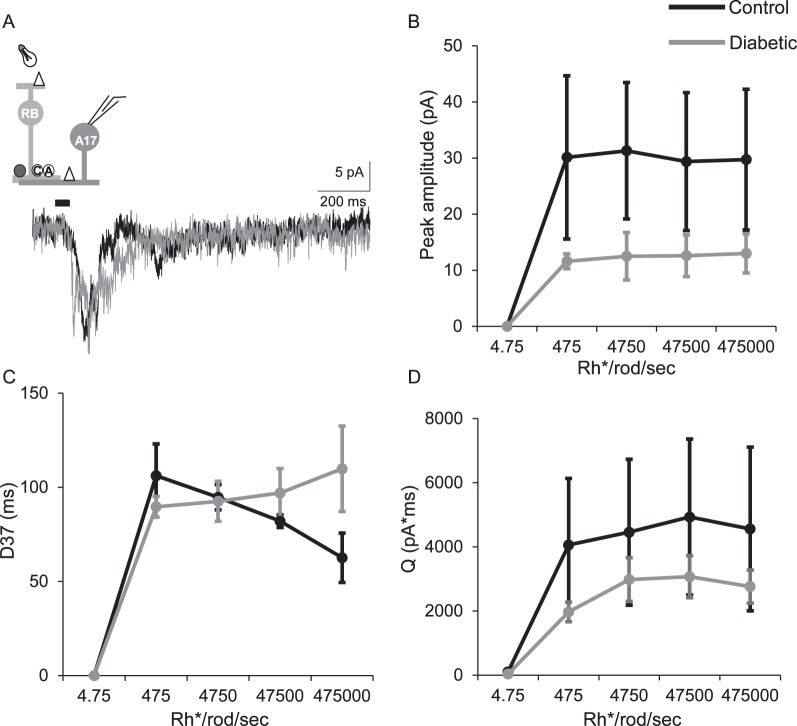
Figure 6.
Excitatory input from rod bipolar cells to downstream A17 amacrine cells is not significantly different in early diabetes. (A) Representative traces of L-EPSCs averaged from two responses at the maximum light intensity recorded from A17 amacrine cells after a 30-ms light stimulus. The inset shows a schematic of a rod bipolar cell being activated by light and releasing glutamate onto AMPARs (white triangle) on an A17 amacrine cell (A17), which is being recorded. (B, D) The peak amplitudes (B, P = 0.7 two-way repeated-measures ANOVA) and charge transfer (D, P = 0.8) are on average reduced at multiple light intensities in diabetic (n = 4 cells from 4 mice) A17 amacrine cells compared to control (n = 3 cells from 3 mice) but this is not statistically significant. The timing (D37, C) of L-EPSC was similar between control and diabetic cells (P = 0.2).

