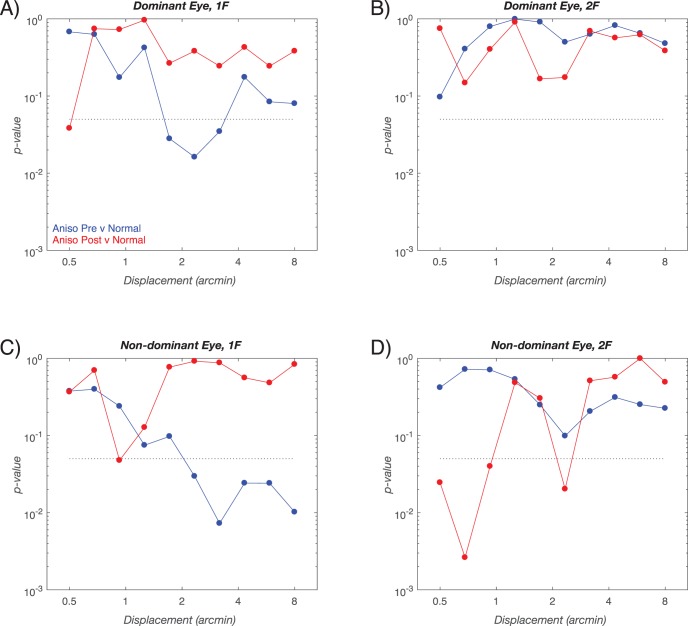
Figure 4.
Initial and outcome visit responses for between group comparisons of response amplitude in dominant (A, B) versus nondominant eyes (C, D). Each Figure plots the result of two-sample t-tests for between group amplitude differences. Initial visit differences are plotted in blue and outcome visit differences are plotted in red. At initial visit, the dominant eyes of children with anisometropia have larger than normal amplitudes in their dominant eyes and smaller than normal amplitudes in their nondominant eyes (see Figs. 2A and 2C for the raw amplitude values that are the basis of the comparison).

