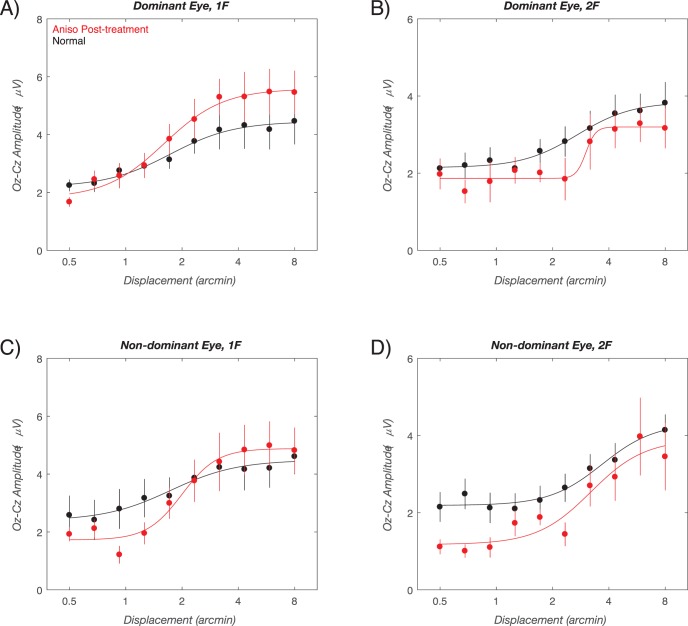
Figure 5.
Outcome visit group-average response functions. VEP amplitude versus displacement size is plotted for the dominant (A, B) and nondominant eyes (C, D) at 1F (A, C) and 2F (B, D). Data for the age-matched normal vision control children is shown in black, with data from the children with anisometropia shown in red. The smooth curves are describing function fits. Error bars: SEM for response amplitude. See text for details.

