Figure 2.
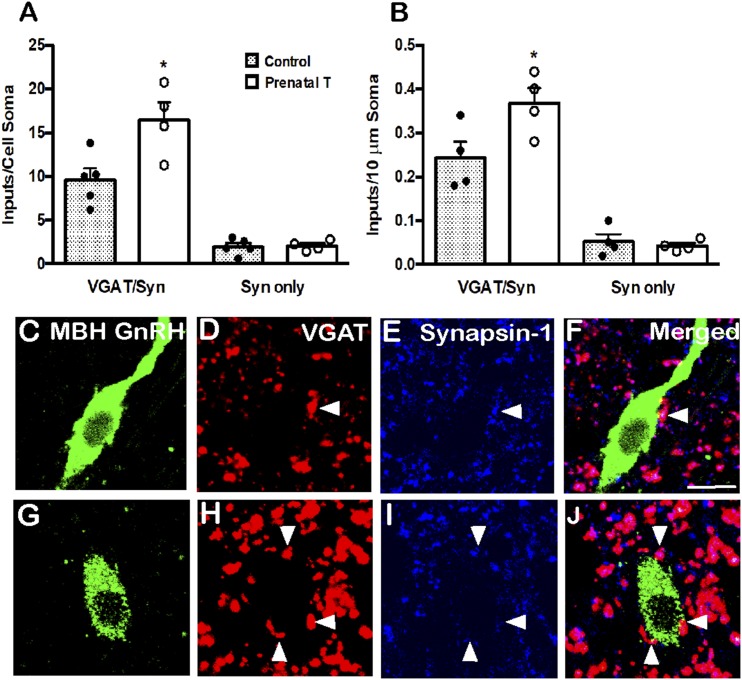
Prenatal T increased VGAT inputs onto MBH GnRH neurons. (A) Mean (±SEM) numbers of VGAT/synapsin (VGAT/Syn) double-labeled inputs and synapsin (Syn) single-labeled inputs onto the somas of MBH GnRH neurons in control (filled bars; n = 6) and prenatal T (open bars; n = 4) ewes. Individual data points representing each animal are shown superimposed above each bar in (A) and (B). (B) Mean (±SEM) numbers of VGAT/Syn and Syn inputs per 10-μm somal cell surface of MBH GnRH neurons in control (filled bars; n = 6) and prenatal T (open bars; n = 4) ewes. *P < 0.05. (C–J) Representative confocal images of 1-μm optical sections triple-labeled for (C and G) GnRH (green), (D and H) VGAT (red), (E and I) synapsin-1 (blue), and (F and J) the merged images from a (C–F) control and (G–J) prenatal T animal. Arrowheads indicate double-labeled inputs on somas. Scale bar, 10 μm.

