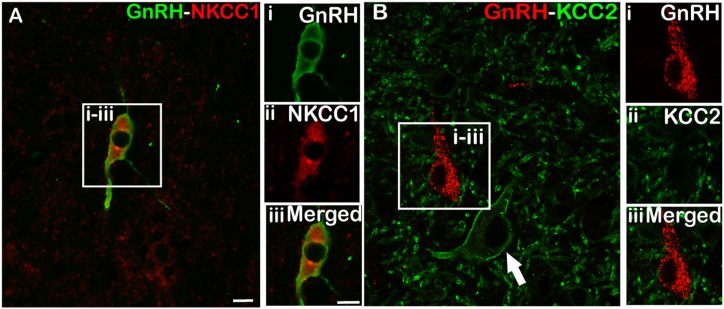
Figure 4.
Representative images of dual-labeled GnRH neurons used for NKCC1 and KCC2 transporter analysis. (A) A POA GnRH cell that colocalizes (i) GnRH (green), (ii) NKCC1 (red) and (iii) merged image. (B) A section immunostained for (i) GnRH (red) and (ii) KCC2 (green), and (iii) the merged image depicting a POA GnRH neuron that does not contain KCC2 despite the presence of adjacent KCC2-labeled cells (arrow). Scale bars, 10 μm.

