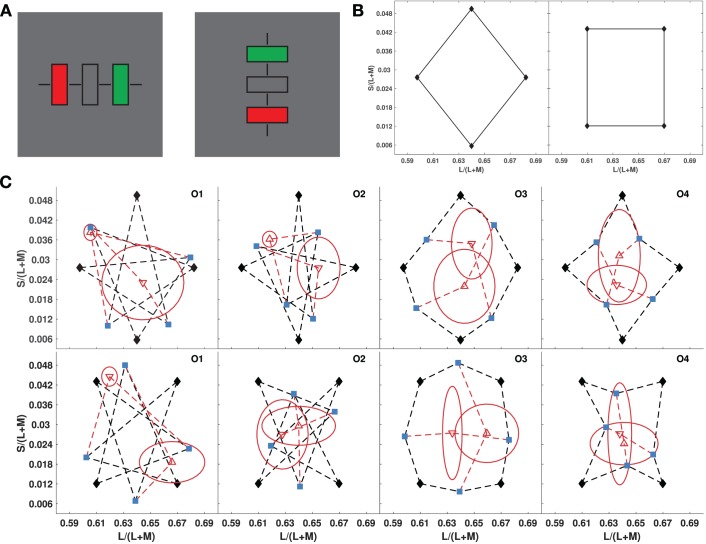
Figure 1.
Tests for affine geometry of color similarity (Experiment 1). (A) Stimulus on each trial, alternated between vertical and horizontal on successive trials, to reduce the effect of aftereffects. Black bars assisted in central fixation. The colors of the flanking rectangles were fixed, and observers adjusted the color of the middle rectangle to their estimate of the midpoint color. (B) Color diamond and square used as the quadrilaterals (MacLeod-Boynton chromaticity diagram). (C) Results for four observers in Experiment 1 for the diamond (top row), and square (bottom row). Blue points show midpoint settings for the four sides of each quadrilateral, connected to their vertices by black dashed lines. Red points show midpoint settings for opposite blue points, connected by red dashed lines. Red ellipses depict standard deviations for the midpoint settings along the major and minor axes directions.

