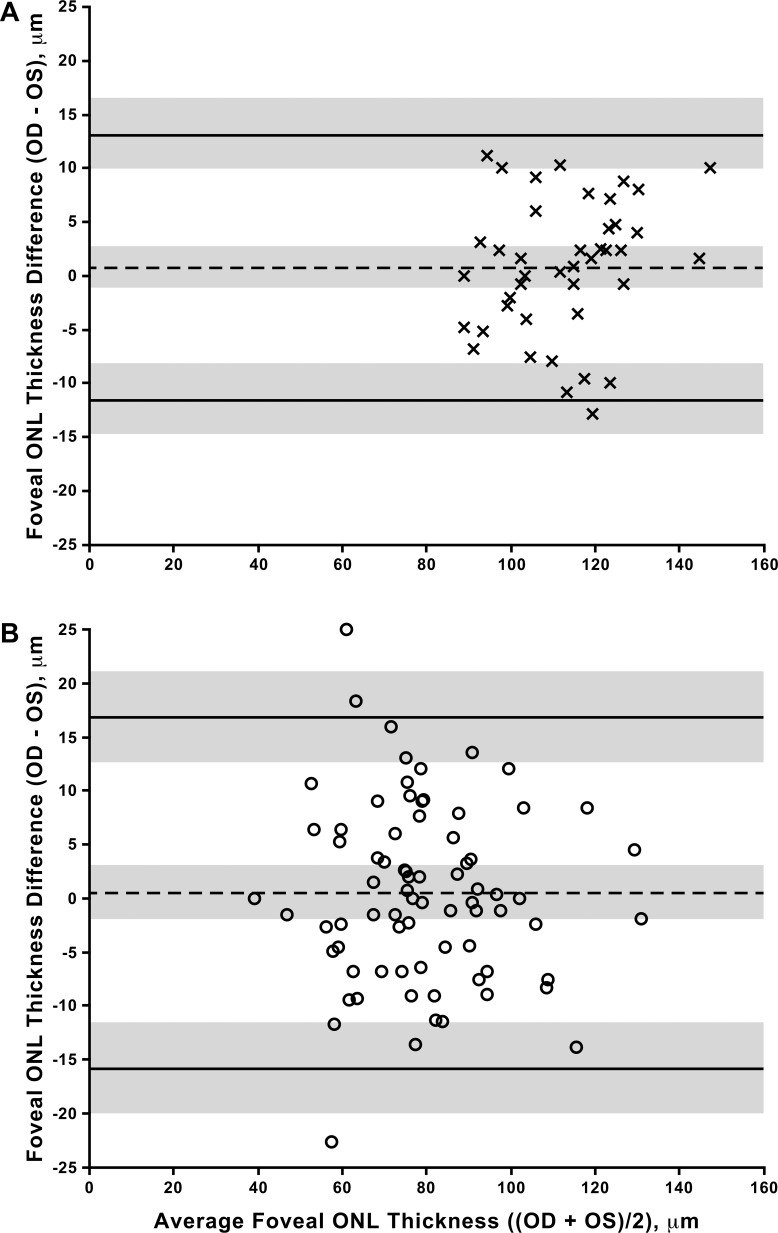
Figure 4.
Interocular symmetry of foveal ONL thickness. Shown are Bland-Altman plots using data from controls (A) and subjects with ACHM (B). No significant bias was observed in either group. Dashed line represents average bias between the eyes, solid lines represent limits of agreement (LOA), gray shading represents CIs for the bias and LOAs.

