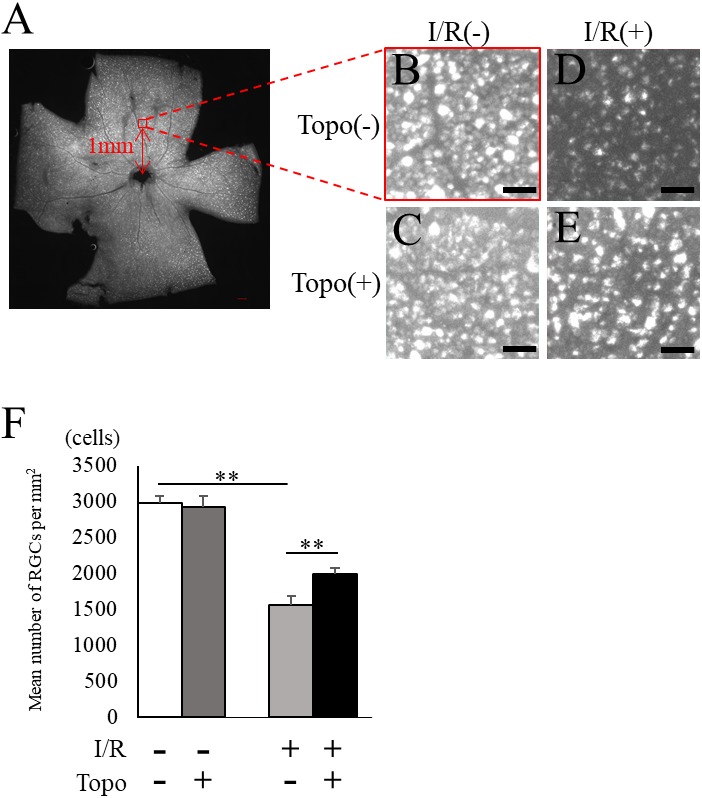
Figure 4. Fluorogold retrograde labeling of RGCs.

(A) A representative quadrant retina with fluorogold-labeled RGCs. 200 µm square with red at one mm from optic disc head indicates the area for RGC densitometry. (B–E) Magnified images for control and post-I/R retina with or without topotecan administration. Scale bars; 200 µm in quadrant retina, 50 µm in magnified images. (F) The quantification of RGC density for each group (n = 5). Note that decrease of RGCs was suppressed by topotecan administration. Error bars indicate the standard error. **p < 0.01, Mann–Whitney’s U test.
