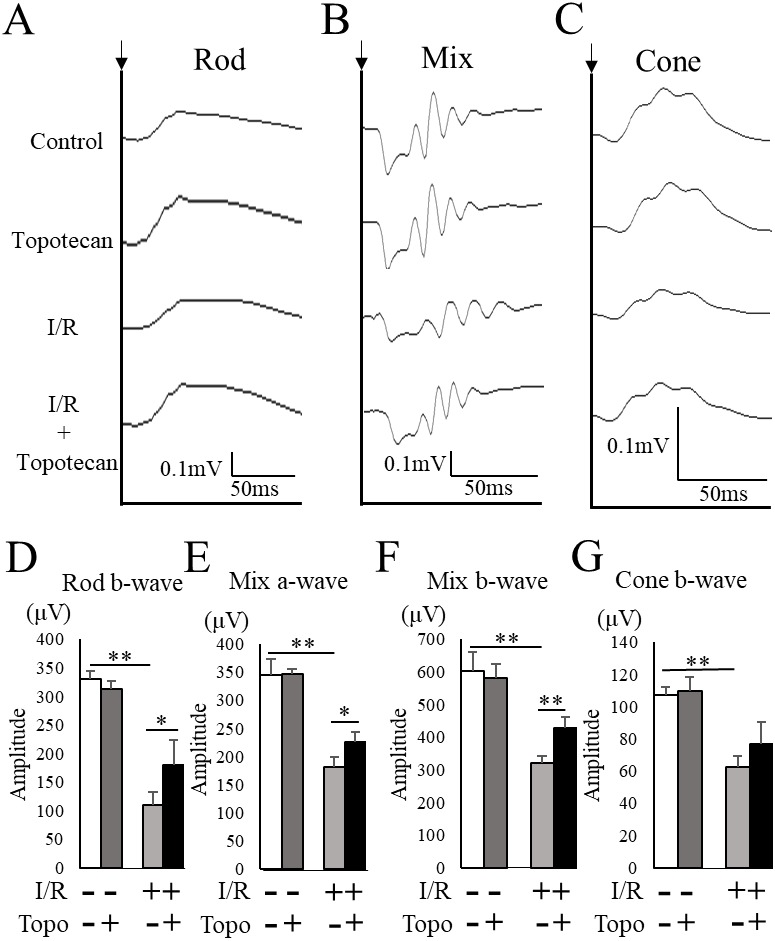
Figure 5. Retinal functionevaluated with ERG.

(A–C) Representative ERG waveforms for rod, mixed, and cone conditions. Black arrows indicate the timing of the stimulation. The averaged amplitudes were shown for rod b-wave (D), mixed a-wave (E), mixed b-wave (F), and cone b-wave (G) (n = 5–6). Note that most of decreased amplitudes were suppressed by topotecan administration. Error bars indicate the standard error. *p < 0.05, **p < 0.01, Mann–Whitney’s U test.
