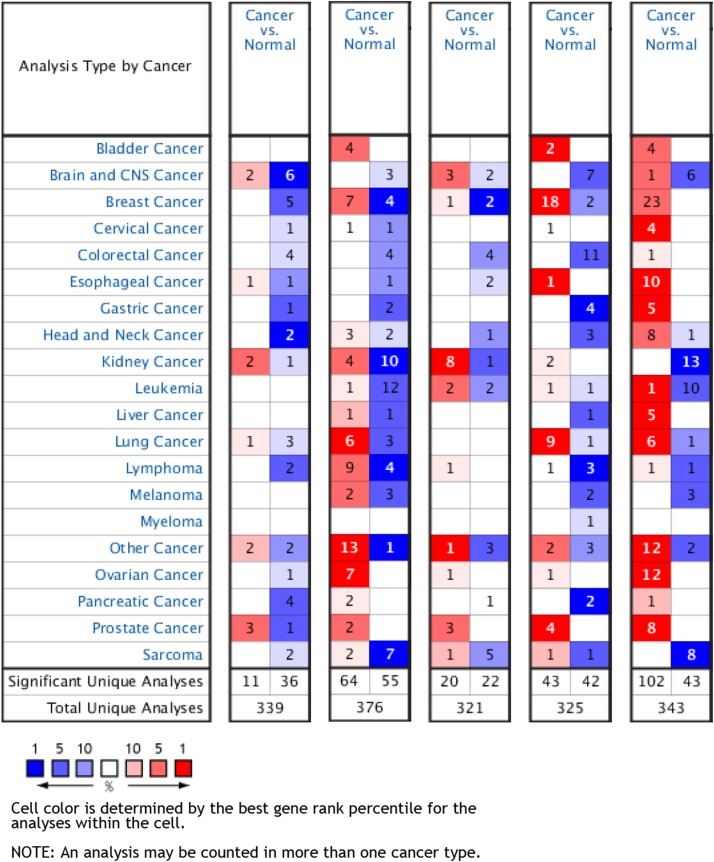
Figure 6. An overview of mRNA levels of hub genes in various types of cancer based on Oncomine data.
The numbers in colored grids shows the counts of datasets with statistically significant mRNA overexpression (red) or low expression (blue) of genes. Grid color was determined by the best gene rank percentile for analysis within the grids. The threshold was set as gene rank percentile = All, P = 0.05, and FC = 2.

