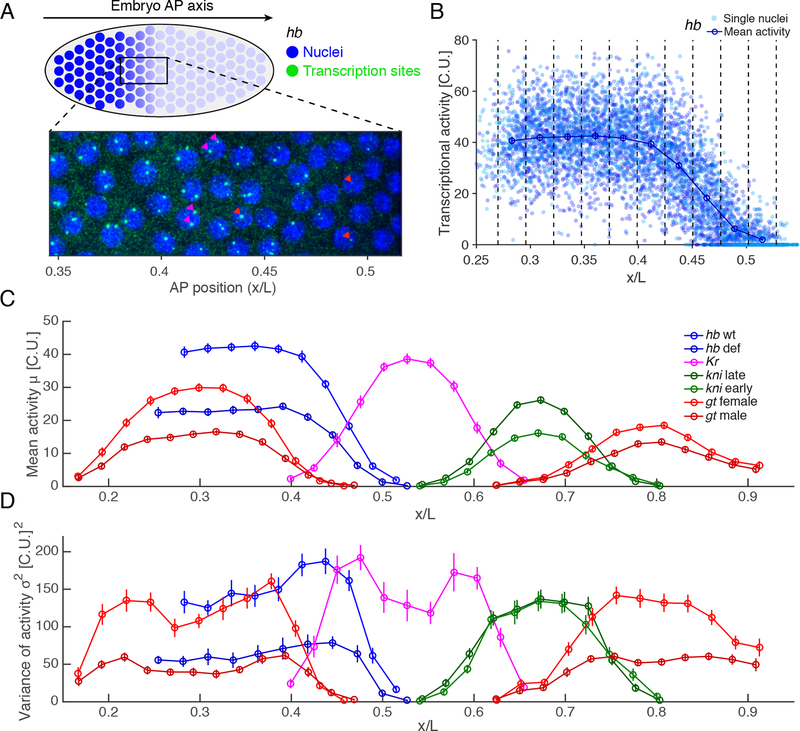
Figure 1: Absolute quantification of gap gene transcriptional activity.
(A) Activity of individual nuclei (blue) for the gene hunchback (hb) measured by single molecule mRNA-FISH (green) in nuclear cycle 13 (nc13) of the blastoderm embryo of length . Red arrowheads: nuclei with two sites of transcription; magenta arrowheads: single site of transcription.
(B) Activity profile of hb as a function of AP position in % egg length for 18 embryos. Activity of individual nuclei from the summed intensity of all transcription sites per nucleus, normalized by the average intensity of a single cytoplasmic mRNA (cytoplasmic unit, C.U.). Blue dots: total mean intensity per nucleus. Vertical dashed lines define AP bins; circles: mean activity in each bin.
(C) Mean activity in C.U. as a function of AP position during nc13 for: hunchback in wild-type (labeled hb wt in blue, embryos); hunchback deficiency with half the hb dosage (hb def, light blue, ); Krüppel (Kr, magenta, ); knirps during early (kni early, green, ) and late nc13 (kni late, light green, ); giant in females with two alleles (gt female, red, ) and in males with one (gt male, light red, ).
(D) Total variance of transcriptional activity as a function of AP position (colorcode as in C).
All error bars are 68% confidence intervals. See also Figure S1.

