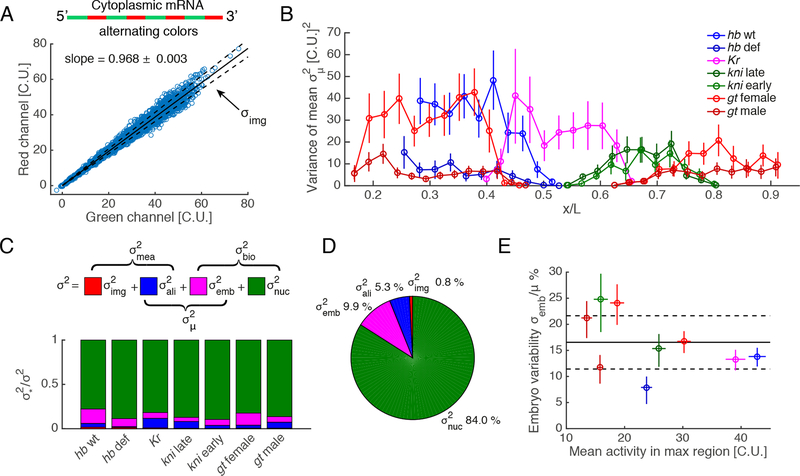
Figure 2: Decomposition of the total variance.
(A) Imaging noise estimation with dual-color smFISH. mRNA molecules are tagged with an alternating probe configuration. Blue circles: activity of single nuclei in 15 hb embryos. In absence of measurement noise or normalization error, both channels should perfectly correlate with slope 1. We characterized the spread along the fitted line (solid line) assuming error in both channels. Dashed lines: envelope.
(B) Variance of the mean across embryos as a function of AP position (color code as in Figure 1C).
(C) Decomposition of the total variance into measurement error and biological variability. Estimates of imaging error (red) alignment error (blue), embryo-to-embryo variability (magenta) are decoupled from the total variance. The remaining variance corresponds to biological variability and is termed intrinsic nucleus-to-nucleus variability in the text (green).
(D) Decomposition of total variance for all the genes pooled together. Nucleus-to-nucleus variability dominates (84%).
(E) Fractional embryo-to-embryo variability (CV) as a function of mean activity (solid black line: mean ratio; dashed lines: 68% confidence intervals) reaches 164% (CV) in the maximally expressed regions that are the most reproducible. This represents absolute reproducibility as all embryos peak at comparable means.
Error bars are 68% confidence intervals. See also Figure S1.

