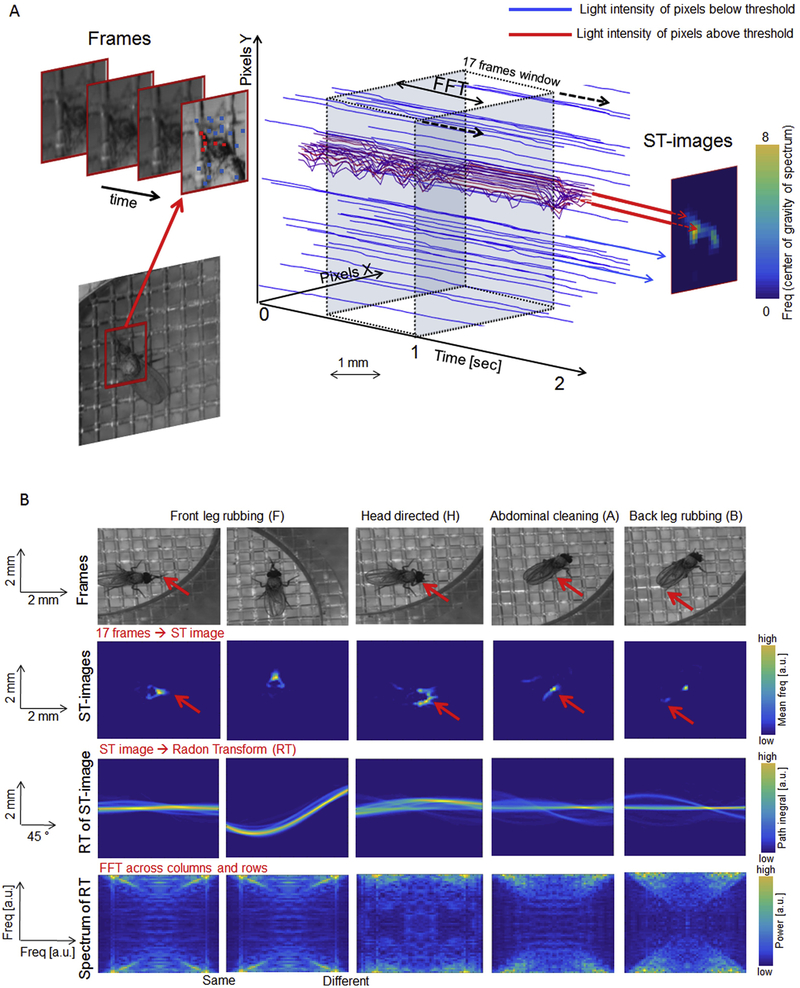
Figure 3. Spatiotemporal feature extraction.
A: The image in each frame is cropped to an area of 25mm2 (80×80 pixels) around the fly’s position and the light intensity is recorded in each pixel across a sliding 17-frame time-window (~0.5 sec) to produce 6400 time-traces of light intensity. Each time-trace is decomposed by Fourier Transform and the center of gravity of each spectrum is computed to generate a movement map called a Spatiotemporal image (ST-image). Time-traces corresponding to pixels where light intensity changes periodically tend to have higher centers of gravity of their spectra - these are indicated by red traces and yellow pixels with high values in the resulting ST-image on the right. The time-traces where light intensity does not change above the threshold (blue traces) are discarded and their corresponding value in the ST-image is set to zero.
B: Examples of grooming behaviors (central frame of sliding window shown for each) and the corresponding ST-images. The first two ST-images are produced from the same behavior (front leg rubbing) but the flies differ in the position and orientation. The other three ST-images are produced from different grooming behaviors. Identification of a grooming movement does not depend on the position or orientation of the fly because ST-images are transformed by Radon Transformation (third row of images) and a second Fast Fourier Transformation to produce 2 D power spectra. Two examples of front-leg rubbing show the same 2 D spectra, while the spectrum from head cleaning is different.

