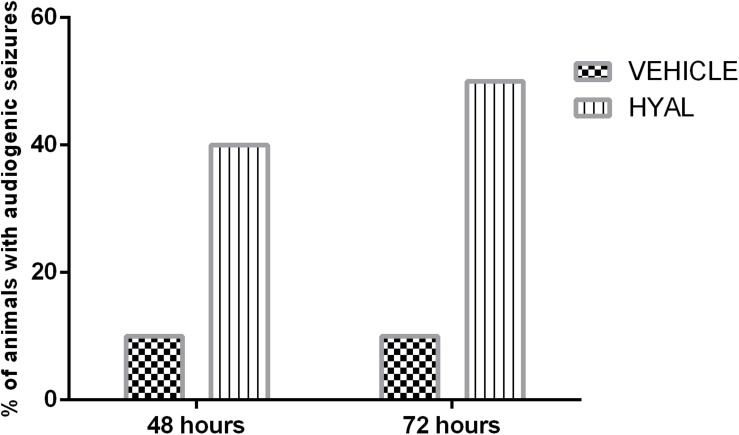
FIGURE 4.
Audiogenic seizures test results. Data shown in the diagram represents the percent of animals demonstrating audiogenic seizures. N = 10. The percent of animals in Vehicle group demonstrating wild running during audiogenic stimuli stayed at the level of 10% on the time points of 48 and 72 h. 40% of animals in Hyal group in total demonstrated audiogenic seizures at the time point of 48 h. 20% of animals demonstrated wild running, 10% showed nearly complete tonic extension except hind feet (KM arbitrary unit “4”) and 10% of animals underwent all the stages of KM scale and died (KM arbitrary unit “6”) after audiogenic stimuli at the time point of 48 h. At the time point of 72 h in vehicle group number of animals with audiogenic seizure was even higher – 50% in total. 40% of animals demonstrated wild running and 10% of animals demonstrated seizures of KM arbitrary unit “4.”

